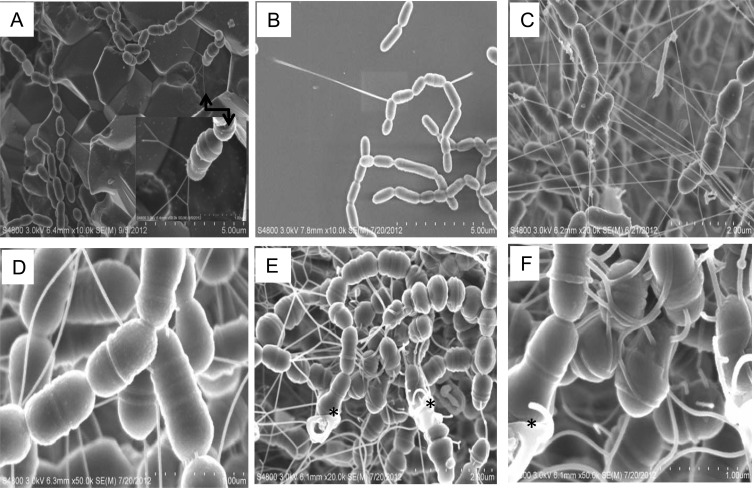
FIG 1.
FE-SEM analysis of the eDNA nanofibers. S. mutans UA159 was grown in BM-glucose on hydroxylapatite (A and C to F) and silicon (B) discs for 4 (A and B) and 24 (C to F) h. Panels A to D show a network of eDNA nanofibers connecting cells to substratum (A and B) and cells to cells (C and D); panels E and F show eDNA from cell lysis that was concentrated around broken cells (indicated by asterisks) and often floating with open ends. The inset in panel A shows a close-up of the area indicated by an arrow. Images in panels A and B were taken at 10,000×, C and E at 20,000×, and D and F at 50,000× magnification.

