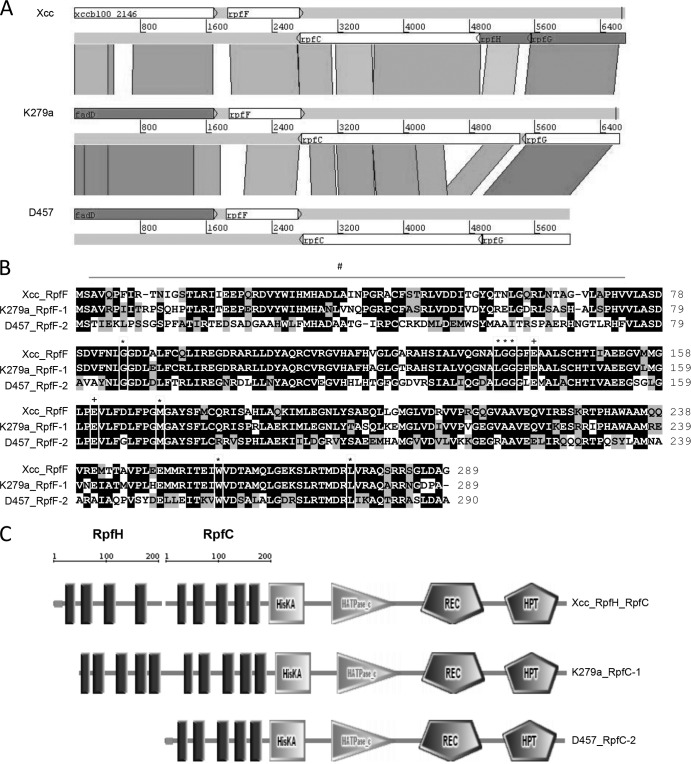
FIG 2.
(A) Comparison of the rpf cluster in X. campestris pv. campestris and S. maltophilia K279a and D457. The alignment was performed with tblastx (percent identity cutoff, 45%) from the BLAST suite and visualized with the Artemis Comparison Tool. Conserved protein regions are paired by shaded blocks where color intensity is proportional to sequence identity. The scales are relative positions in base pairs. (B) Alignment of RpfF proteins from X. campestris pv. campestris and S. maltophilia K279a (RpfF-1) and D457 (RpfF-2). Symbols: #, hypervariable region; *, binding pocket residues; +, glutamate catalytic residues. (C) SMART software analysis of RpfC and RpfH from X. campestris pv. campestris and RpfC from S. maltophilia K279a and D457, where HisKA is a histidine kinase domain, HATPase_c is a histidine ATPase domain, REC is a CheY-like receiver domain, and HPT is a histidine phosphotransferase domain.

