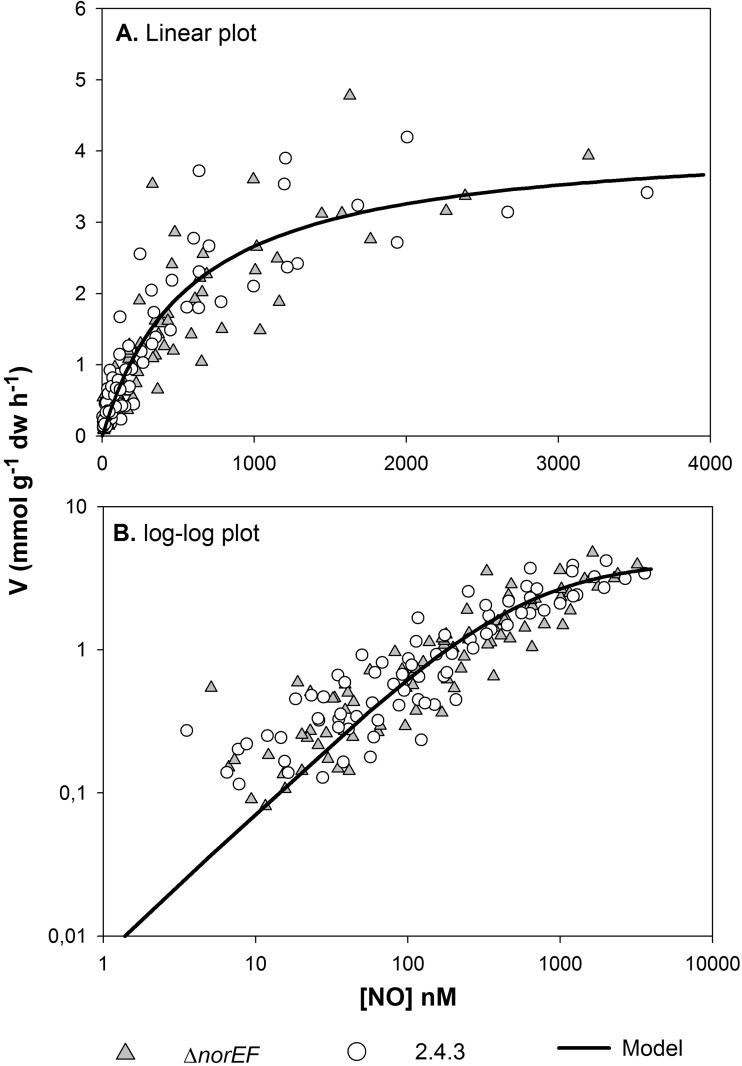
FIG 4.
Kinetics of NO reduction in the 2.4.3 wild type versus the ΔnorEF mutant. (A) Rates (mmol g−1 cell dry weight h−1) plotted against the NO concentration in liquid (nM), together with the model fitted to the entire data set (Vmax = 4.2 mmol g−1 cell dw h−1, Ks = 577 nM). (B) Log-log plot of the same data to visualize the relationships between the strains and model at low NO concentrations.

