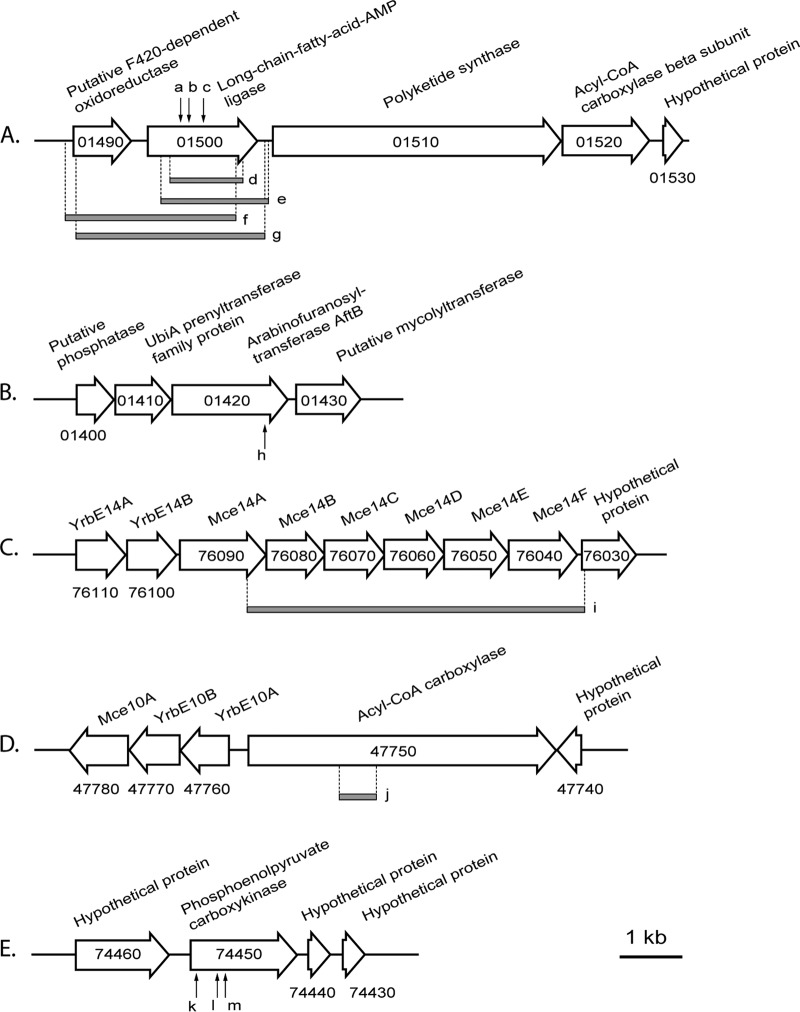
FIG 2.
Visualization of pMA5096 insertions in the genome of N. nova SH22a transposon-induced mutants and identification of genes adjacent to the transposition loci. Arrows indicate the insertion sites of pMA5096, and the gray bars represent the missing chromosomal regions caused by pMA5096 transposition. Mutants: a, OC11-7-29; b, SE3-4-18; c, SE16-4-35; d, SE18-8-1; e, SE13-5-5; f, OC20-2-42; g, SE18-1-3; h, SE10-4-21; i, OC14-14-5; j, SE9-8-16; k, OC26-3-28; l, OC22-3-17; m, OC19-4-17. The prefix “NONO_c” of locus tags is omitted in the diagram. The lengths of open arrows showing the genes indicate the proportional lengths of transcription of the corresponding genes. Annotations of genes are given above the corresponding arrows.

