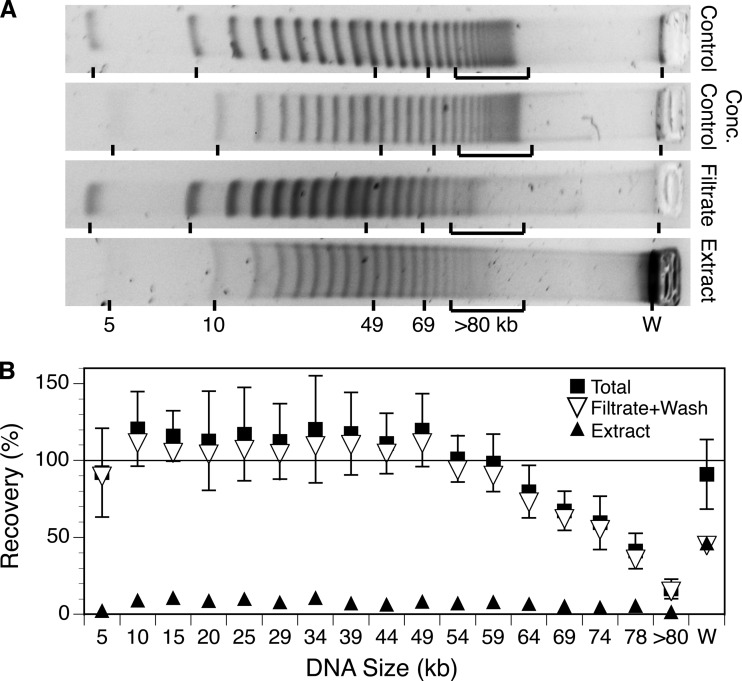
FIG 4.
Changes in the size distribution of the DNA in a 5-kb ladder as a result of filtration through and extraction from a 0.02-μm Anotop filter, shown as pulsed-field gel images (A) and as calculated percent recoveries for each band size (B). (A) Representative gel images of unconcentrated and concentrated control ladders, the material passing through the 0.02-μm filter, and the material extracted from the filter. An approximately equal mass of material was loaded in each lane on the same gel and separated using conditions indicated in the text. (B) Recoveries for each size band were calculated as a percentage of the intensity in the corresponding control ladder after scaling intensity to the total DNA recovered as determined by fluorometry. W refers to material trapped in the well.

