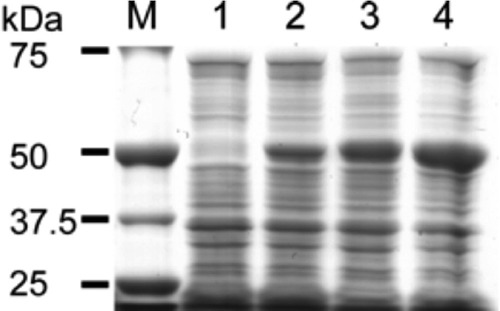
FIG 1.

SDS-PAGE showing the increase in expression of soluble TrzN by laboratory evolution. The molecular mass marker is shown in lane M. Lanes 1 to 4 show the increasing cellular concentrations of expression of soluble TrzN in rounds 1 (lane 2; A159V), 2 (lane 3; A159V/L131P), and 3 (lane 4; A159V/L131P/D38N) compared with the native TrzN (lane 1).
