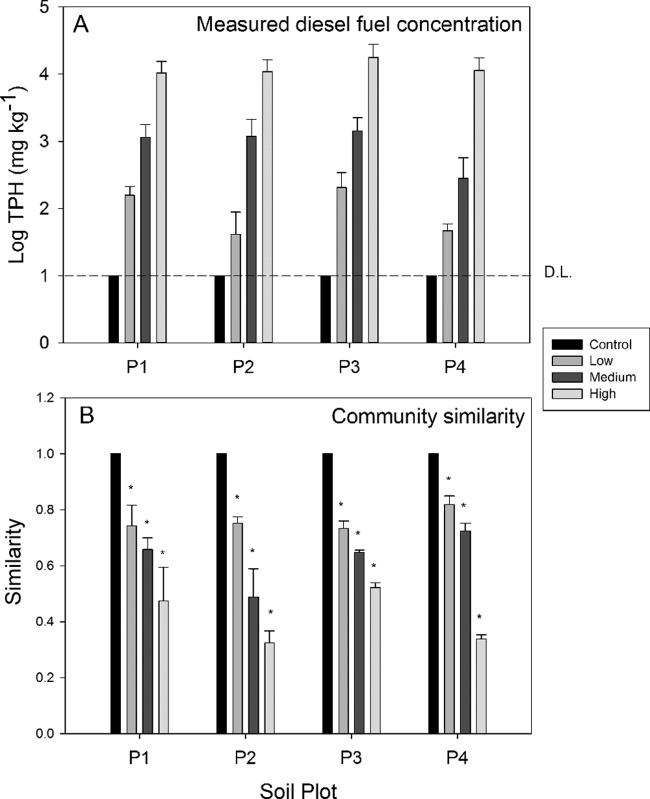
FIG 1.
The average measured total petroleum hydrocarbon (TPH) concentration and bacterial community similarity of samples across SAB spiking fuel concentration ranges and soil plots. (A) The average measured TPH log concentration for the spiking fuel ranges within each soil plot. The dashed line indicates the TPH detection limit (DL). (B) The average community similarity within each soil plot based on the weighted UniFrac distance. Error bars account for the standard deviation between biological replicates. *, significant decline in community similarity was found (P < 0.05).

