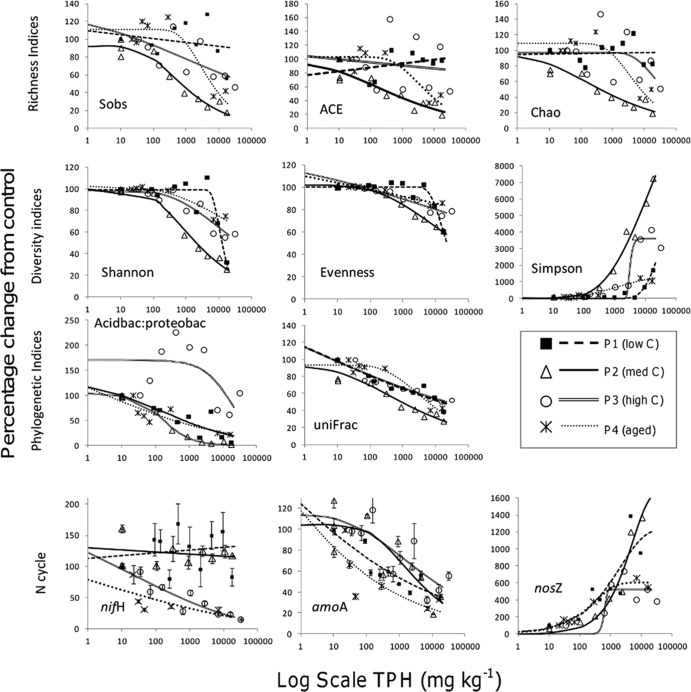
FIG 3.
The effect of increasing SAB fuel concentrations on richness, diversity, and phylogenetic indices and key functional genes within the nitrogen cycle (nifH, nitrogen fixation; amoA, ammonium oxidation; nosZ, denitrification). Values are expressed as percentage change from the control. The best-fitting dose response curve as determined by AIC was fitted to each data set in the drc R package. The selected dose-response regression model was used to calculate EC20 values.

