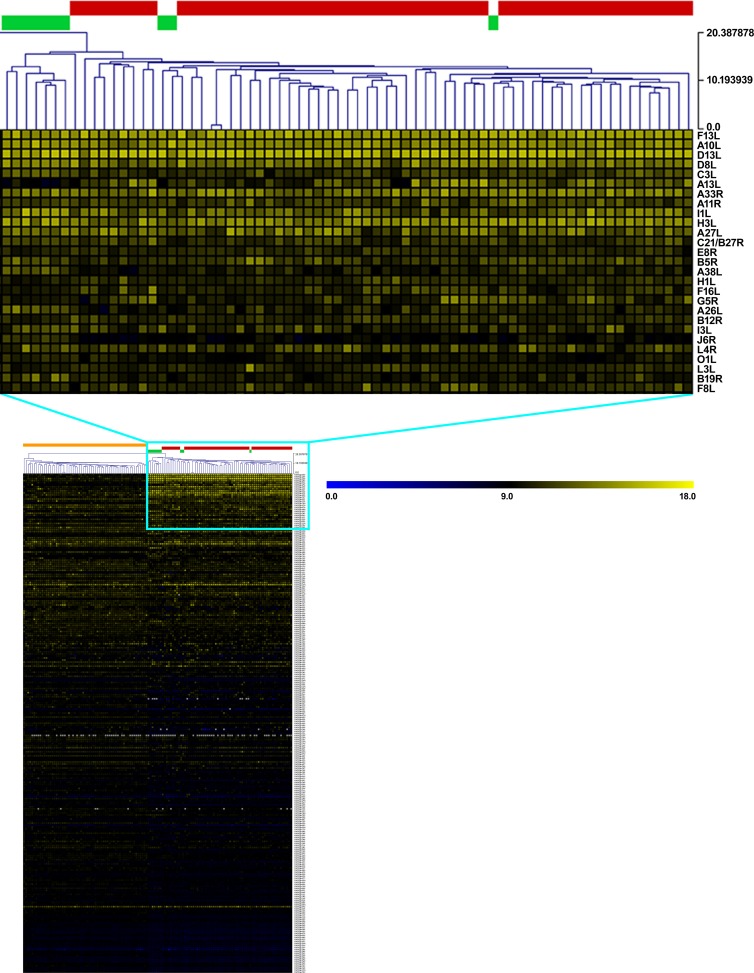
FIG 1.
Hierarchical clustering of vaccinia virus proteins recognized by antibody from vaccinia virus-naive and Dryvax- and ACAM2000-vaccinated individuals. Protein microarrays were probed with sera from 61 vaccinia virus-naive individuals and 71 primary vaccinated individuals (10 individuals vaccinated with Dryvax and 61 vaccinated with ACAM2000). Antibody binding to the vaccinia virus proteins was measured with Alexa Fluor 647-conjugated anti-human IgG (H+L). Hierarchical clustering, using Euclidean distance average linkage method with normalized and log2-transformed data, was used to visualize protein microarray results. Naive and vaccinated sera are listed in columns while vaccinia virus protein-antibody interactions (in rows) are sorted by increasing P value. The color key at the top right of the heat map at the bottom of the figure (main heat map) shows the scale of log2-transformed signal intensity (0 to 18), and the nodal scale at the top right of the magnified section of the heat map, also corresponding to minimum and maximum signal intensity units, uses a true branch length structure. The color blocks at the top of the main heat map represent the subject groups: orange before primary vaccination (naive); red primary ACAM2000 vaccination; green, primary Dryvax vaccination. Only significant protein-antibody binding interactions (P < 0.0002; blue box) among vaccinated individuals are magnified (top) for visualization.

