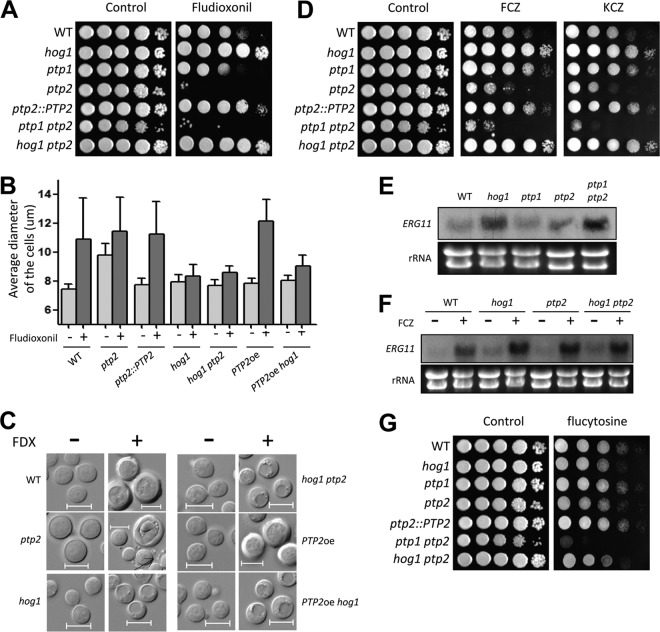
FIG 5.
Roles of Ptp1 and Ptp2 in antifungal drug susceptibilities of C. neoformans. (A, D, and G) Each strain was grown for 16 h at 30°C in liquid YPD medium, 10-fold serially diluted, and spotted onto YPD medium containing 2 μg/ml fludioxonil (A), 14 μg/ml fluconazole (D), 0.03 μg/ml ketoconazole (D), or 400 μg/ml flucytosine (G). (B) Each strain (WT [strain H99] and hog1, ptp2, ptp2::PTP2, hog1 ptp2, PTP2oe [YSB2569] and PTP2oe hog1 [YSB2658] strains), which were grown to the mid-logarithmic phase, was reincubated in YPD medium with or without fludioxonil (10 μg/ml) at 30°C for 48 h with shaking and then photographed by using a Spot insight digital camera. The cell diameter of each strain was quantitatively measured by using the Spot Imaging solutions. The y axis indicates the average diameter of cells. A total of 100 cells per strain were measured. (C) Representative pictures of fludioxonil (FDX)-treated or nontreated cells. Bars, 10 μm. A black arrow indicates cell debris-like particles. (E and F) Northern blot analysis results for the basal and azole-induced expression levels of ERG11 in ptp1Δ and ptp2Δ mutants. To determine the basal expression levels of ERG11, each indicated strain was grown to mid-logarithmic phase at 30°C in YPD liquid medium and total RNA was extracted (E). These cells were further treated with 10 μg/ml fluconazole for 90 min and were subjected to total RNA isolation (F). The Northern blot membrane was hybridized with the ERG11-specific probe, washed, and developed. Ethidium bromide staining results of rRNA were used as loading controls.

