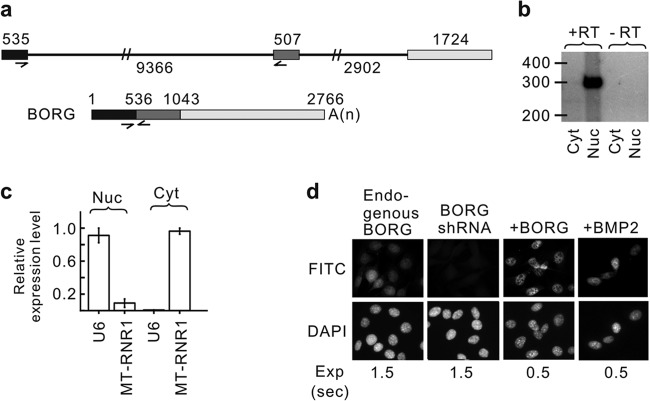
FIG 1.
BORG lncRNA is a nuclear transcript. (a) Genomic architecture of the mouse BORG gene. The numbers indicate the lengths of the three exons (shown as rectangles) and two introns (shown as thin lines). The half-arrows mark the positions of PCR primers used in the majority of the experiments in this study. The processed, mature BORG transcript is shown at the bottom, with the numbers indicating the position of the first nucleotide of each exon from the 5′ end. A(n) represents the position of the poly(A) tail. The slash marks on the introns indicate that they have not been drawn to scale. (b) RT-PCRs on the nuclear (Nuc) and cytoplasmic (Cyt) fractions obtained from C2C12 cells using radiolabeled BORG primers shown in panel a that flank an exon-exon junction. The lanes marked −RT are control reactions in which the reverse transcriptase was omitted. The numbers mark the relative positions of double-stranded DNA of the indicated sizes (in nucleotides). The size of the amplicon corresponds to the expected size in the spliced BORG RNA. (c) Analysis of the levels of U6 (nuclear marker) and MT-RNR1 (cytoplasmic marker) in the nuclear and cytoplasmic fractionation using quantitative RT-PCR. The error bars represent the standard deviations calculated based on at least three independent experiments. (d) In situ hybridization assays using a FITC-conjugated BORG probe on wild-type C2C12 cells (endogenous BORG), C2C12 cells transfected with an shRNA against BORG to show specificity (BORG shRNA), C12C12 cells transfected with a full-length BORG overexpression cassette (+BORG), and BMP2-stimulated C2C12 cells (+BMP2). The exposure time (Exp) for each FITC image is shown at the bottom in seconds.

