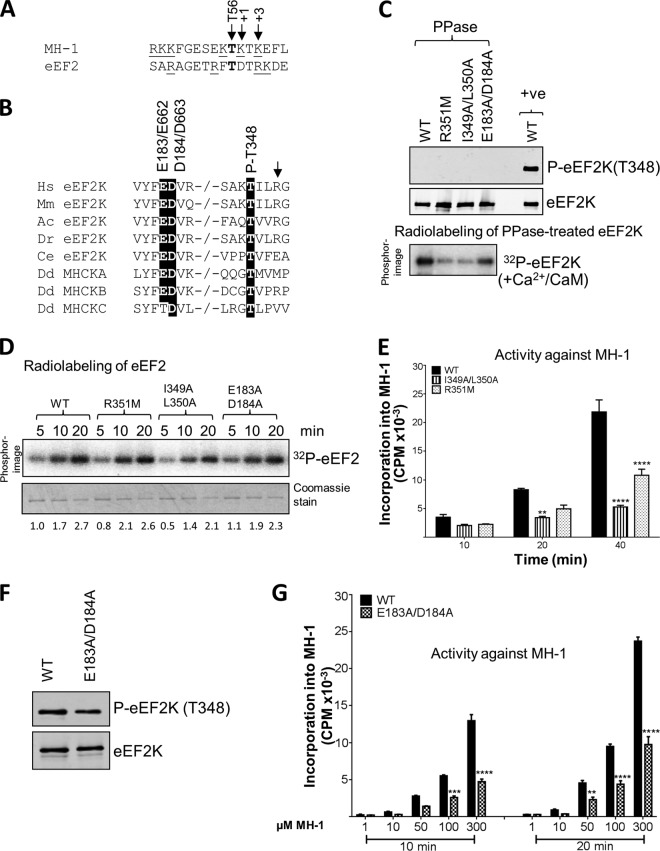
FIG 4.
Effects of mutations at residues potentially involved in the autophosphorylation of eEF2K. (A) The residue phosphorylated is shown in bold, positively charged residues are underlined, and the residues at +1 and +3 are italicized and denoted by arrows. The phosphorylated residue (Thr56 in eEF2K) is also indicated by an arrow. The phosphorylation sites in eEF2 and MH-1 were identified previously (reference 16 and 29, respectively). (B) Alignment of relevant regions of eEF2K sequences from selected species and Dictyostelium MHCK isoforms; conserved residues of interest are indicated by black boxes. −/− indicates a gap in the sequence. Abbreviations for species are given in the legend to Fig. 2. The arrow denotes the basic residue present at +3 relative to the autophosphorylation site. (C) Recombinant GST-eEF2K or selected point mutants were incubated with alkaline phosphatase (PPase) for 20 min at 30°C, and samples were taken for Western blot analysis prior to incubating the phosphatase-treated eEF2K with Ca2+/CaM, as indicated, with ATP or [γ-32P]ATP for 10 min at 30°C. Samples were analyzed by SDS-PAGE and phosphorimaging or Western blotting using the indicated antibodies. The upper part shows data for phosphatase-treated sample; the lower part shows data for incubation of the material with radioactive ATP. (D) Activities of selected point mutants of eEF2K were determined against eEF2 (without pretreating the GST-eEF2K with phosphatase). All assays were performed within the linear range of the assay. Numbers below each lane indicate the level of radiolabeling relative to that of WT eEF2K at 2 min. (E) Activities of selected point mutants against the MH-1 peptide. All assays were performed within the linear range of the assay. Data are means ± SEM (n = 3). **, P < 0.01; ****, P < 0.0001. (F) Level of autophosphorylation for WT eEF2K and the E183A/D184A mutant determined by SDS-PAGE and Western blotting using a phospho-Thr348 antibody. (G) The activities of WT and the E183A/D184A mutant eEF2K against various concentrations of the MH-1 peptide. Data are means ± SEM (n = 3). **, P < 0.01; ***, P < 0.001; ****, P < 0.0001.

