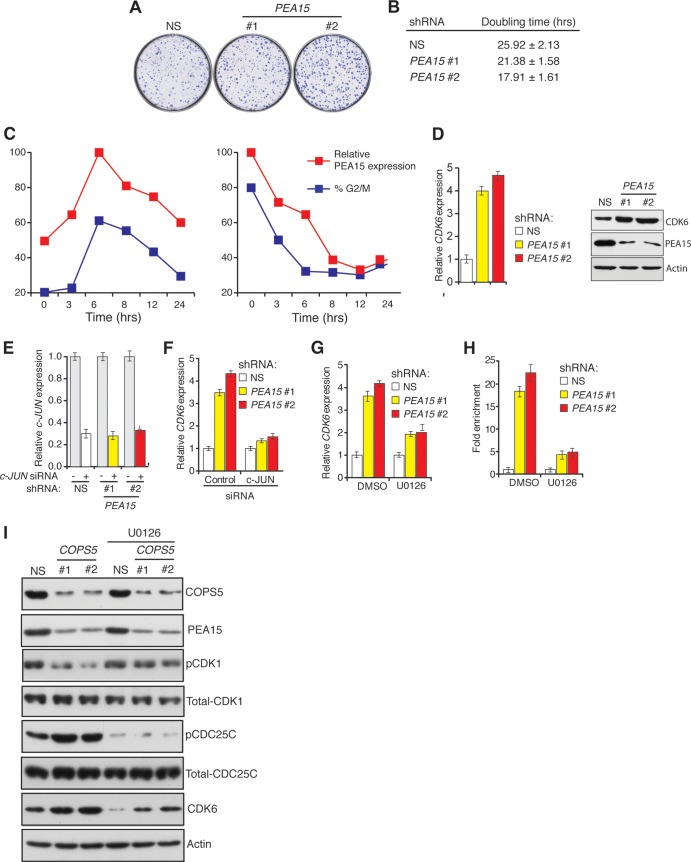
FIG 7.
PEA15 regulates CDK6 transcription via transcription factor c-JUN. (A) Crystal violet staining to assay colony-forming ability of HCT116 cells expressing NS or PEA15 (1 and 2) shRNAs. Representative wells are presented. (B) A trypan blue assay was used to determine the doubling time of HCT116 cells expressing NS or PEA15 shRNAs. (C) Cell cycle-dependent expression of PEA15 in HCT116 cells synchronized by double thymidine block (left) or nocodazole (right). PEA15 proteins levels were determined at different times following release from synchronization. PEA15 expression was determined relative to maximal expression, which was set at 100%. The percentage of cells in G2/M phase at each time point was determined by flow cytometry. (D) RT-qPCR analysis (n = 3) (left) or immunoblot analysis (right) to monitor CDK6 expression in HCT116 cells expressing NS or PEA15 shRNAs. Immunoblotting for PEA15 and actin was performed as controls. Error bars indicate standard errors of the means. (E) RT-qPCR analysis to monitor c-JUN mRNA levels in HCT116 cells expressing NS or PEA15 shRNAs (n = 3) and treated with control (−) or c-JUN (+) siRNA. (F) RT-qPCR analysis to monitor CDK6 mRNA levels in HCT116 cells expressing NS or PEA15 shRNAs and treated with control or c-JUN siRNA. Error bars indicate standard errors of the means. (G) RT-qPCR analysis to monitor CDK6 mRNA levels (n = 3) in HCT116 cells expressing the indicated shRNAs and treated with 10 μM U0126 or a dimethyl sulfoxide (DMSO) control. Error bars indicate standard errors of the means. (H) c-JUN ChIP analysis at the CDK6 promoter in HCT116 cells expressing NS or PEA15 shRNAs and treated with a dimethyl sulfoxide control or 10 μM U0126 (n = 3). Error bars indicate standard errors of the means. (I) Immunoblot analysis for the indicated proteins in HCT116 cells expressing NS or COPS5 shRNAs without or with 10 μM U0126 treatment.

