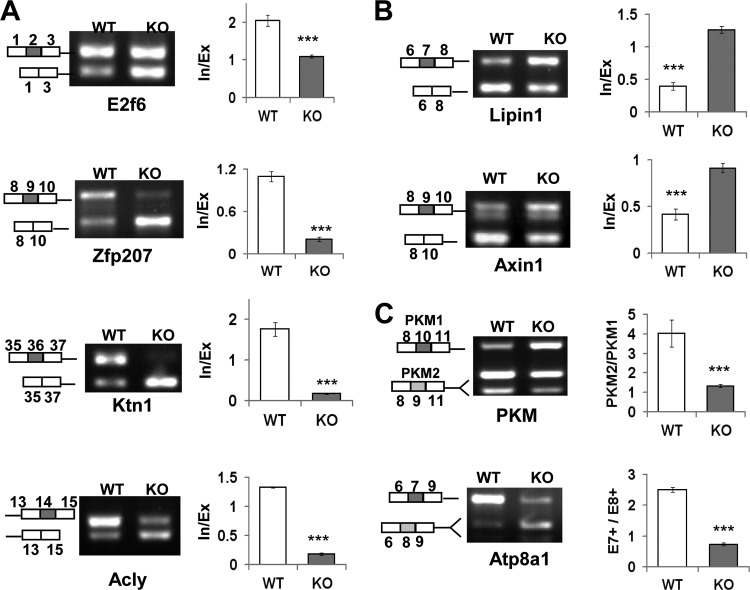
FIG 3.
SRSF10 depletion causes both exon inclusion and exclusion in vivo. (A) Examples of SRSF10-dependent exon inclusion. The indicated transcripts containing alternatively spliced exons were analyzed by RT-PCR using RNAs extracted from WT and KO MEF cells. RNA products are indicated schematically on the left. Quantification of their RNA products measured as inclusion/exclusion (In/Ex) ratios is shown on the right bar graphs. Values shown are the mean ± SD (n = 3). Significance for each detected change was evaluated by Student's t test. (B) Examples of SRSF10-dependent exon exclusion were analyzed as described for panel A. (C) Examples of mutually exclusive exons regulated by SRSF10 were analyzed as described for panel A. Note that the PCR products were digested with either PstI (PKM) or BglII (Atp8a1) to distinguish their isoforms with the same size.

