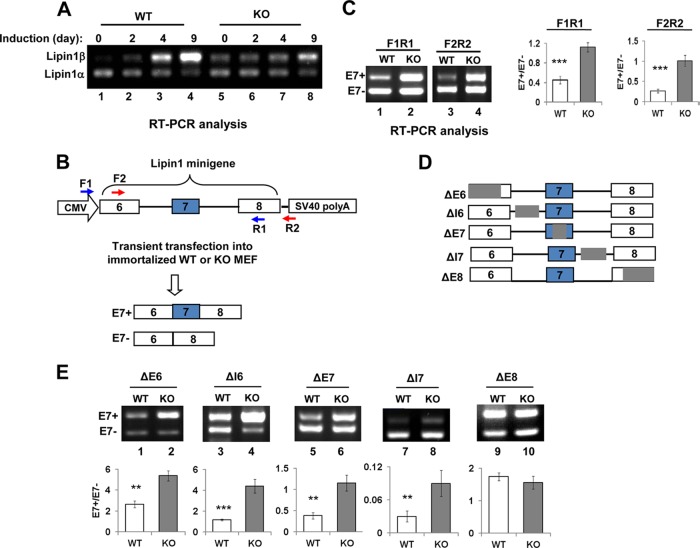
FIG 4.
Mapping of SRSF10-regulated cis element using lipin1 minigene derivatives. (A) Lipin1α/β mRNA and PPARγ were measured by RT-PCR at the indicated differentiation days (top). (B) Diagram of lipin1 minigene plasmid and its two splicing isoforms containing or lacking exon 7. The intact lipin1 exon 6 to 8 genomic fragment was cloned into pcDNA3.1 vector. The alternative exon 7 is shown in the blue box, while constitutive exons 6 and 8 are shown in white boxes. The positions of two primer pairs for in vivo splicing analysis are indicated as numbered arrows. (C) RT-PCR was performed with RNAs extracted from immortalized WT and KO MEF cells transiently transfected with the lipin1 minigene plasmid, and products were analyzed directly on a 1.5% agarose gel and visualized with ethidium bromide (EtBr). Results with the F1/R1 and F2/R2 primer pairs are shown (left). Quantification of lipin1 minigene RNA products measured as the exon 7 inclusion/exclusion (E7+/E7−) ratio is shown on the right histogram. Values shown are the mean ± SD (n = 3). The significance of each detected change was evaluated by Student's t test. (D) Diagram of lipin1 minigene truncated plasmids. Note that the gray region was deleted from each of indicated mutants. (E) Each of the lipin1 minigene mutants was transfected into immortalized WT and KO MEF cells. RT-PCR analysis of each mutant and quantification were performed as described for panel C. Note that F1/R1 primer pairs were used for all truncates except ΔE8; F2/R2 primer pairs were used for ΔE8.

