FIG 4.

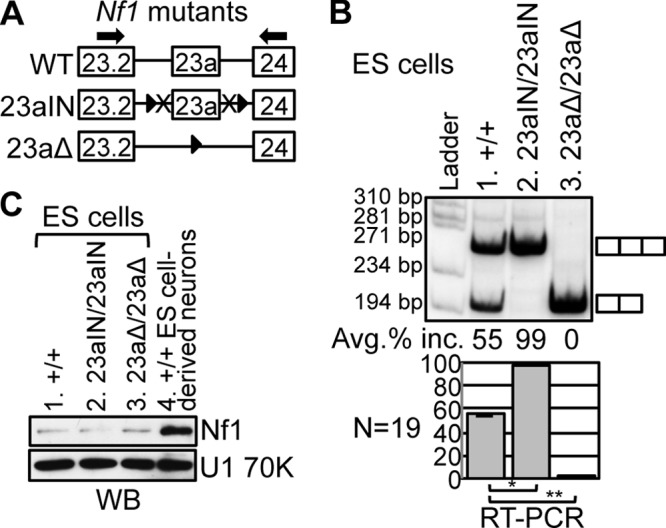
Manipulation of endogenous Nf1 exon 23a inclusion in mouse ES cells. (A) Depiction of the relevant portions of the Nf1 mutant genes in ES cell lines. See the legend to Fig. 3 for details. The Nf1 23aIN/23aIN cell line contains the 23aIN mutations depicted in Fig. 2A. In the Nf1 23aΔ/23aΔ mutant, exon 23a is replaced by a loxP site, but the remainder of the Nf1 gene remains intact. Arrows indicate locations of RT-PCR primers. The RT-PCR band size was 266 bp if exon 23a was included and 203 bp if exon 23a was skipped. (B) RT-PCR showing endogenous Nf1 exon 23a inclusion in ES cell mutants. Error bars represent standard errors. *, P = 4.5 × 10⁻²⁷; **, P = 2.4 × 10⁻³². (C) Western blot analysis showing total Nf1 protein (∼250 kDa) expression in ES cells (lanes 1 to 3) and ES cell-derived neurons (lane 4). U1 70K (∼70 kDa) was used as a loading control.
