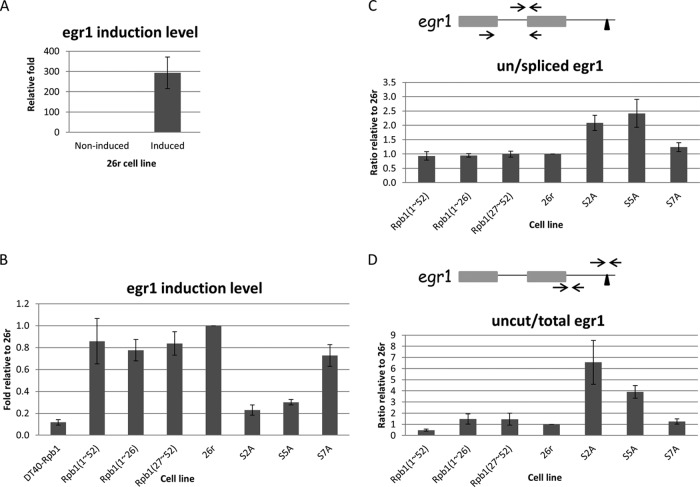
FIG 2.
Impact of CTD mutations on Egr1 transcription, splicing and 3′-end processing. (A) 26r cells were cultured in medium containing 1 μg/ml tet for 24 h, and then treated with dimethyl sulfoxide (DMSO) or ionomycin and PMA for 20 min to induce Egr1 expression. Egr1 induction levels were measured by RT-qPCR and are plotted relative to the noninduced control (DMSO treatment) (n = 3). (B) Analysis of Egr1 induction levels in various cell lines. Cells were treated with Tet for 24 h and induced with ionomycin and PMA for 20 min. Egr1 mRNA levels were measured using RT-qPCR and are plotted relative to levels in 26r cells (n = 3). (C) Cells were treated as described for panel B. The ratios of unspliced to spliced Egr1 mRNA were determined using RT-qPCR and are plotted relative to the ratios for 26r cells. The diagram depicts the two-exon Egr1 gene. The two arrows depict the primers used to detect spliced products, and the primer set (top) detected unspliced Egr1 (n = 3). (D) Cells were treated as described for panel B. Ratios of uncleaved to total Egr1 mRNA were measured using RT-qPCR and are plotted relative to the ratio detected in 26r cells. The left primer set was used to measure total Egr1 mRNA, and the right set detected uncleaved RNA (n = 3). Error bars indicate standard deviations.

