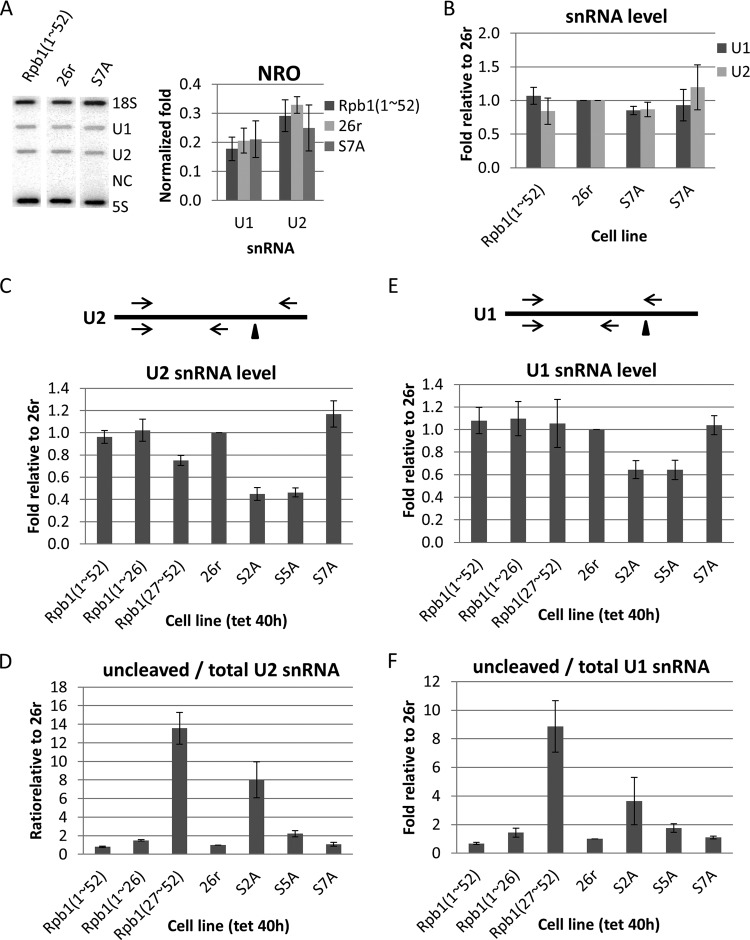
FIG 5.
Effects of CTD mutations on snRNA expression. (A) Effects of the S7A mutation on snRNA transcription were analyzed in nuclear run-on experiments. Nuclei were harvested from cells treated with Tet for 40 h. Nascent RNA was labeled with [32P]UTP for 30 min and purified and analyzed in a slot blot assay with the DNA oligonucleotides indicated on the top panel. NC, negative control (antisense U1). Signals from each gene were normalized to 18S RNA and plotted (bottom panel) (n = 3). (B) Steady-state levels of U1 and U2 snRNAs in two independent cell lines expressing Rpb1-S7A compared with Rpb1(1–52) and 26r cells. Cells were treated with Tet for 6 days. Extracted RNA was analyzed using RT-qPCR. Levels of U1 and U2 RNA were normalized to 18S RNA, and values relative to 26r cells were plotted (n = 3). (C) Total U2 snRNA levels in Rpb1(27–52), S2A, and S5A cells. Cells were treated with Tet for 40 h. Levels of total U2 snRNA were measured using RT-qPCR and plotted relative to levels in 26r cells (n = 3). (D) U2 snRNA 3′ cleavage in Rpb1(27–52) and S2A cells. Cells were treated as described for panel C. Ratios of uncleaved versus total U2 snRNA were measured using RT-qPCR and plotted relative to levels in 26r cells (n = 3). (E) Total U1 snRNA levels were analyzed as described for panel C (n = 3). (F) U1 snRNA 3′-end cleavage efficiency was measured as described for panel D. Diagrams show snRNA transcripts. Triangles and arrows denote 3′-end cleavage sites and primers, respectively. The top primer set was used to detect uncleaved snRNA, and the bottom set was for total snRNA (n = 3). Error bars indicate standard deviations.

