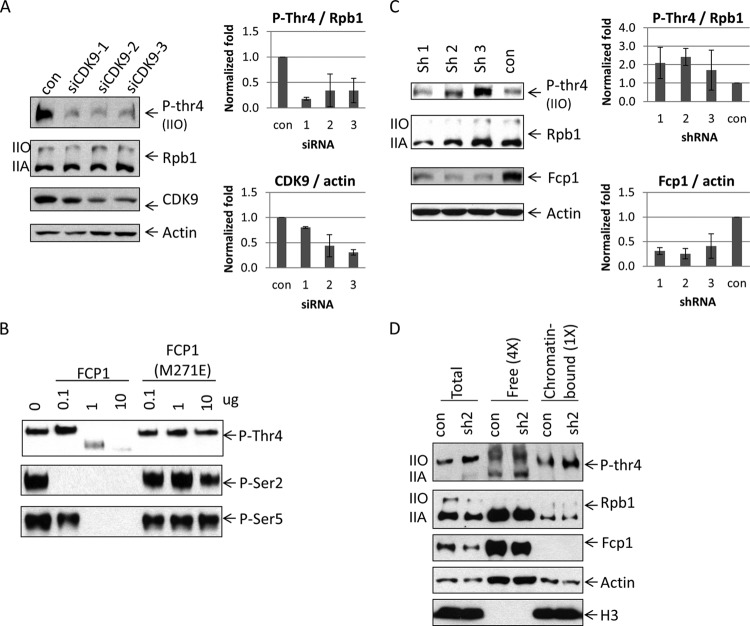
FIG 6.
Phosphorylation and dephosphorylation of Thr 4. (A) CDK9 knockdown decreased phosphorylation on Thr 4. HEK293 cells were transfected with control siRNA and siRNAs targeting CDK9. Cell lysates were analyzed by Western blotting (left panel). CDK9 and P-Thr 4 levels were quantified after CDK9 knockdown (right panel). CDK9 protein levels were normalized to actin (right, bottom panel), and P-Thr 4 levels were normalized to Rpb1 (right, upper panel) (n = 2). (B) In vitro dephosphorylation of Thr 4. GST-CTD was phosphorylated by HeLa nuclear extract and incubated with Fcp1 or Fcp(M271E). Samples were analyzed by Western blotting with antibodies that detected P-Thr 4 (top panel) or P-Ser 2 or P-Ser 5 (bottom panels). (C) Knockdown of Fcp1 causes increased levels of P-Thr4. HEK293 cells were transfected with vectors expressing one of three shRNAs targeting Fcp1 or an shRNA targeting GFP (con). Cell lysates were analyzed by Western blotting with the indicated antibodies (left panel). Fcp1 and P-Thr4 levels were quantified after knockdown (right panel). Fcp1 protein levels were normalized to actin (right, bottom panel), and P-Thr4 was normalized to total Rpb1 (right, upper panel). Ratios relative to control were plotted (n = 3). Error bars indicate standard deviations. (D) HEK293 cells, transfected with plasmids carrying shRNAs, were subjected to subcellular fractionation. Cell lysates were analyzed using Western blotting. Four times more of the free chromatin unbound fraction was loaded compared to the chromatin-bound fraction. Histone H3 protein levels served as controls for the subcellular fractionation assay.

