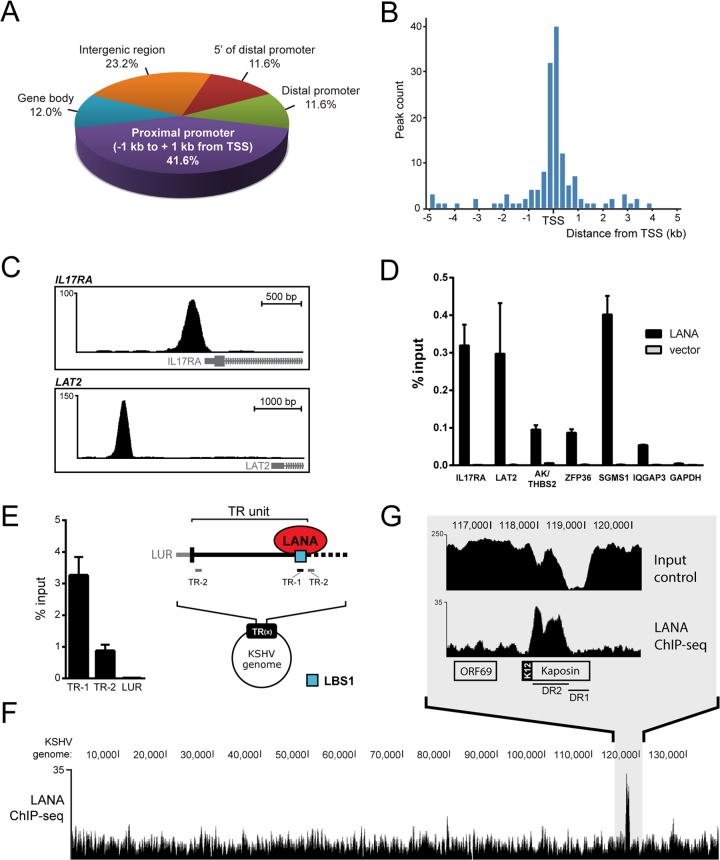
FIG 1.
LANA accumulates at host promoters in iSLK-219 cells. (A) Genomic distribution of LANA peaks in iSLK-219 cells. Indicated ranges from TSS are as follows: distal promoter, −1 kb to −10 kb; 5′ of distal promoter, −10 kb to −50 kb. (B) Distribution of LANA peak summit distances from TSSs in bins of 250 bp. (C) Screen shots from the UCSC browser (hg19) depicting examples of LANA peaks detected within the promoter regions of IL17RA (top) and LAT2 (bottom) (http://genome.ucsc.edu) (98). (D) ChIP-qPCR of LANA in SLK cells transfected with a plasmid expressing LANA or an empty vector. LANA enrichment at the indicated annotated peaks on the host genome is shown as percentage of input. (E) ChIP-qPCR of LANA that targets indicated viral sites (TR-1/TR-2) on viral TR units. TR-1 encompasses the LANA-binding site 1 (LBS1, blue square), which is localized at the junction of TR units. (F) Screen shot from the UCSC browser showing the nonredundant distribution of sequencing reads from the ChIP-seq of LANA that aligned to the KSHV genome long unique region (LUR). (G) Close-up view of the LANA-enriched region spanning the DR2 segment of the Kaposin locus. Input material was also sequenced and is shown as a sequencing control of this GC-rich DNA segment.

