FIG 3.
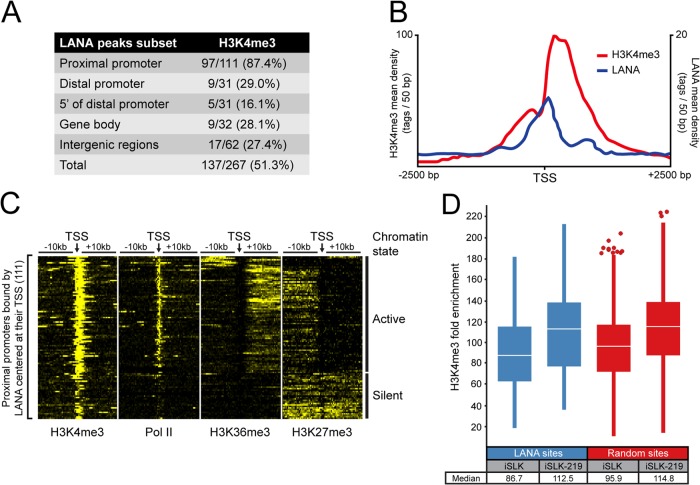
Most promoters occupied by LANA are marked with H3K4 trimethylation. (A) The overlap of LANA- and H3K4me3-enriched regions according to their genomic location in iSLK-219s. Indicated ranges from TSS are as follows: proximal promoter, −1 kb to + 1 kb; distal promoter, −1 kb to −10 kb; 5′ of distal promoter, −10 kb to −50 kb. (B) Distribution of LANA and H3K4me3 within 2.5 kb of TSSs from proximal promoters occupied by LANA. (C) Density of H3K4me3, H3K27me3, H3K36me3, and Pol II within 10-kb of TSSs from proximal promoters bound by LANA. The heat map shows normalized tag counts clustered by the SeqMiner program. Contrast level was set at 25. According to their chromatin features, LANA-binding sites were clustered in two groups: active and silent chromatin. (D) Box plot analysis of H3K4me3 levels (fold enrichment above background determined by the MACS software) at LANA-binding sites or at a random set of genomic H3K4me3-enriched sites. Data are from proximal promoters of uninfected iSLKs and KSHV-infected iSLKs (iSLK-219). Outliers are shown as circles, and the median is indicated by a white line.

