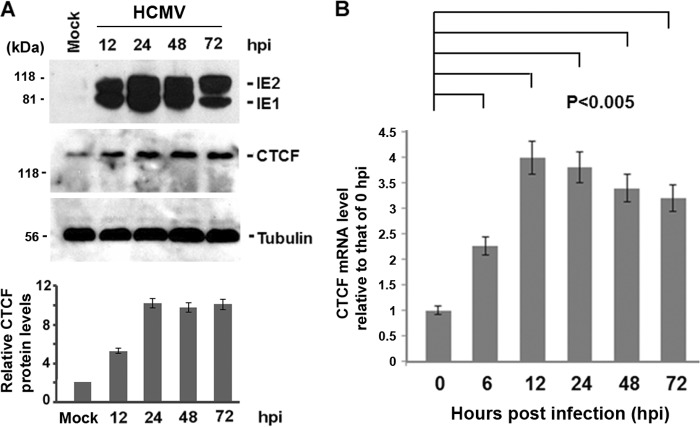
FIG 1.
HCMV induces CTCF production at an early time of infection. MRC-5 cells were infected with HCMV at an MOI of 0.5 for different times, as indicated. (A) Whole-cell lysates were collected and subjected to SDS-PAGE to examine cellular and viral protein production by Western blot assay with antibodies against viral proteins (IE1/IE2) and CTCF. Tubulin was used as a sample-loading control. The fold increases in CTCF levels relative to mock-treated and tubulin controls were calculated by Quantity One 4.5.0 software (Bio-Rad Laboratories, Richmond, CA). Quantification of CTCF levels (means ± standard deviations) is shown at the bottom as bar graphs generated from at least three independent viral infections and Western blot assays. (B) Total RNA was isolated from mock-infected (0 hpi) or HCMV-infected cells, and 1 μg of the resulting sample was analyzed by quantitative RT-PCR. CTCF mRNA levels at different time points after HCMV infection relative to the level at 0 hpi are shown. The bar graph represents the mean ± standard deviation from three independent experiments. Statistically significant differences were calculated by Student's t test and are indicated at the top (P < 0.005).

