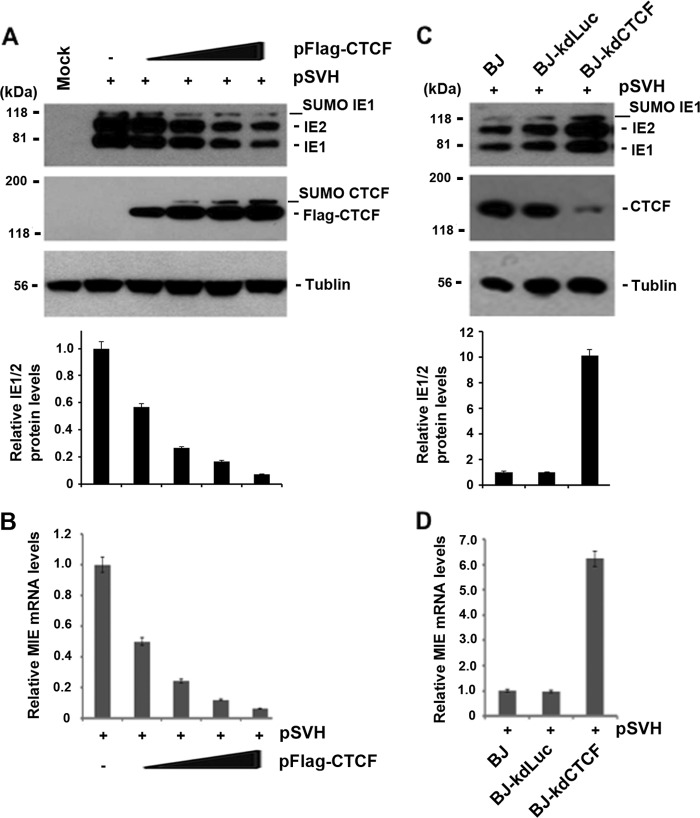
FIG 2.
Effects of CTCF protein levels on MIE gene expression. (A) 293T cells were used for the cotransfection of 1 μg of pSVH (expressing IE1/IE2 under MIEP control) together with different amounts (0.5, 1, 2, and 3 μg) of pFlag-CTCF or the vector control (by using 3 μg of pcDNA3 to supplement the total DNA in the cotransfection system). Whole-cell lysate samples were used for Western blot assays to examine the production of IE1, IE2, and CTCF. Tubulin was used as a sample-loading control. The fold variations in IE1/2 levels relative to pSVH and the vector control were quantified by Quantity One 4.5.0 software and are shown at the bottom as bar graphs (means ± standard deviations) generated from three independent experiments. (B) Same as panel A, except that total RNA samples (1 μg for each assay) were used for real-time RT-PCR to examine IE1 mRNA. The bar graph shows the average value of the IE1 mRNA level of pSVH with pFlag-CTCF relative to that of pSVH alone from three independent experiments (means ± standard deviations). (C) Western blot assays performed to examine CTCF depletion and IE1/IE2 production after the transfection of pSVH into BJ cells or BJ cells stably expressing shRNA against CTCF or control luciferase (Luc). Tubulin was used to control the sample loading. The fold increases in IE1/2 levels relative to BJ cells alone were calculated by Quantity One 4.5.0 software and are shown as bar graphs below the corresponding Western blot assays. (D) Same as panel C, except that real-time RT-PCR was used to examine IE1 mRNA levels in stable knockdown cell lines transfected with pSVH. The levels of IE1 mRNA in different cells were compared to that in control BJ cells. The bar graph represents the means ± standard deviations of three independent experiments.

