
FIG 5.
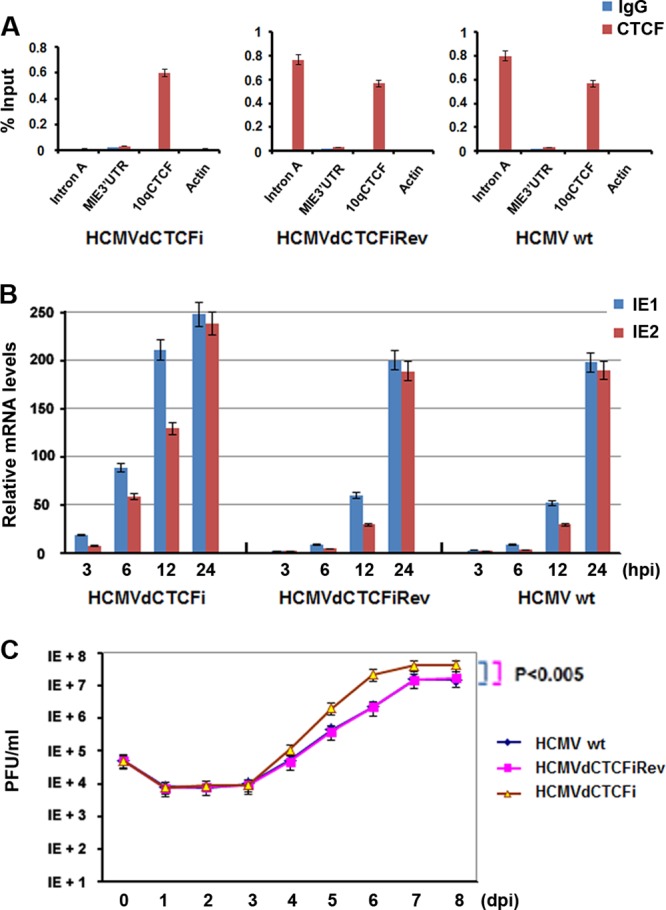
Deletion of the CTCF motif from intron A led to increases in HCMV IE gene expression and viral DNA replication. (A) ChIP-qPCR analysis of CTCF or control IgG with primers specific for the regions indicated in MRC-5 cells infected with HCMVwt, HCMVdCTCFiRev, or HCMVdCTCFi at an MOI of 0.5 for 12 h. The bar graph represents the mean percentage of the input in each ChIP from three independent PCRs ± the standard deviation. (B) Quantitative RT-PCR analysis of IE1 and IE2 mRNAs in MRC-5 cells infected with HCMVs at an MOI of 0.1 at the indicated times after infection. The bar graph represents the relative RT-PCR values from three independent experiments (means ± standard deviations). (C) MRC-5 cells were infected with the HCMVs indicated at an MOI of 0.05, and the viral growth curve was determined by using PFU assays at the indicated times after infection. Student's t test was used to statistically analyze the difference between HCMVdCTCFi infection and HCMVwt (P < 0.005) and HCMVdCTCFiRev (P < 0.005) infections.