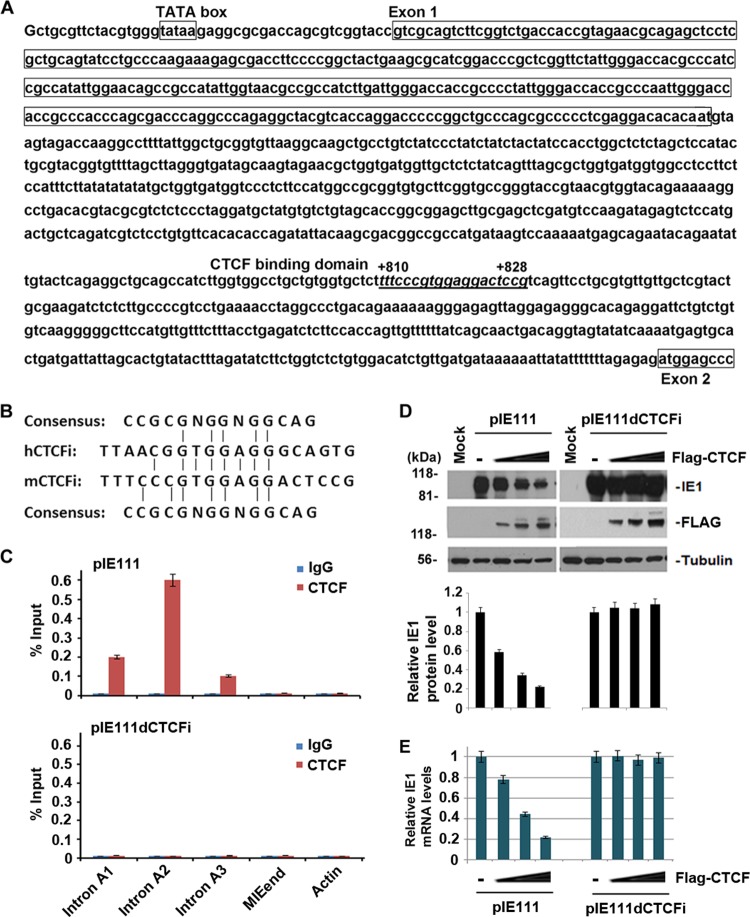
FIG 7.
The CTCF-binding domain in intron A is conserved in HCMV and MCMV. (A) DNA sequences of the MCMV MIE genes, from the TATA box to the beginning of exon 2. The CTCF BS is underlined. Exon 1 sequences are boxed. (B) Homologous comparison of the CTCF-binding sequence from HCMV and MCMV to the consensus sequence of the canonical CTCF-binding motif. (C) ChIP-qPCR analysis of CTCF or control IgG with primers specific for the indicated regions in 293T cells transfected with either pIE111 (a plasmid expressing the MCMV MIE gene under the control of the MIEP) (top) or pIE111dCTCFi (derived from pIE111 but with the CTCF BS deleted) (bottom) at 24 h posttransfection. (D) Western blotting was used to determine MCMV IE1 expression in 293T cells cotransfected with various amount of pFlag-CTCF (0.5, 1, and 2 μg) and either pIE111 (left) or pIE111dCTCFi (right) at 24 h posttransfection. Flag antibody was used to determine CTCF expression, and tubulin served as a sample-loading control. Quantification of IE1 levels was done by Quantity One 4.5.0 software, and normalized IE1 levels are shown as bar graphs below the corresponding Western blot assays. (E) Same as panel D, except that quantitative RT-PCR was used to determine IE1 mRNA levels. The bar graph represents the relative RT-PCR values (means ± standard deviations) from three independent experiments.

