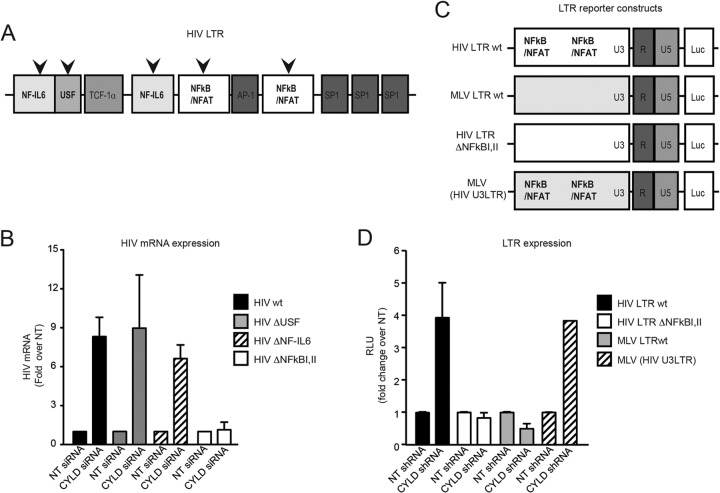
FIG 3.
The increase in HIV transcription in CYLD knockdown cells is NF-κB/NFAT dependent. (A) Schematic representation of the different viruses used for panel B. (B) HEK 293T cells transiently transfected with CYLD siRNA (CYLD siRNA) or nontargeting siRNA (NT siRNA) were infected with the indicated viruses. HIV mRNA expression was analyzed by qPCR using the ΔΔCT method at 24 h postinfection; data were plotted as fold change compared to nontargeting siRNA-transfected cells. Values are means plus SEM for two independent experiments. The values for the NT siRNA were set to 1, and values represent fold change over NT siRNA-expressing cells. Expression of HIV WT mRNA relative to the housekeeping gene rsp11 is 0.091, that of HIV ΔUSF is 0.046, that of HIV ΔNF-IL-6 is 0.04, and that of HIV ΔNF-κB I,II is 0.09. (C) Schematic representation of the different LTR reporter plasmids used for panel D. (D) HEK 293T cells stably expressing CYLD shRNA or NT shRNA were transfected with luciferase reporter plasmid under the control of HIV LTR, HIV-ΔNF-κB I,II LTR, MLV LTR, or an MLV (HIV U3) LTR chimera (HIV U3 promoter region inserted into MLV) and TK-Renilla as a control. Luciferase and Renilla expression was measured 48 h later. Luciferase values were normalized to the Renilla values and then plotted as fold change over the NT shRNA control. Values are means plus SEM for two independent experiments. The values for the NT shRNA were set to 1, and values represent fold change over NT shRNA-expressing cells. Average raw RLU values for the HIV-LTR WT NT control were 121,155 ± 1,270, those for the HIV-ΔNF-κBI,II LTR NT control were 306,691 ± 36168, those for the MLV-LTR NT control were 83,520 ± 10,650, and those for the MLV (HIV U3) LTR NT control were 131,173 ± 2,352. The average of Renilla control values was 2,180 ± 768.

