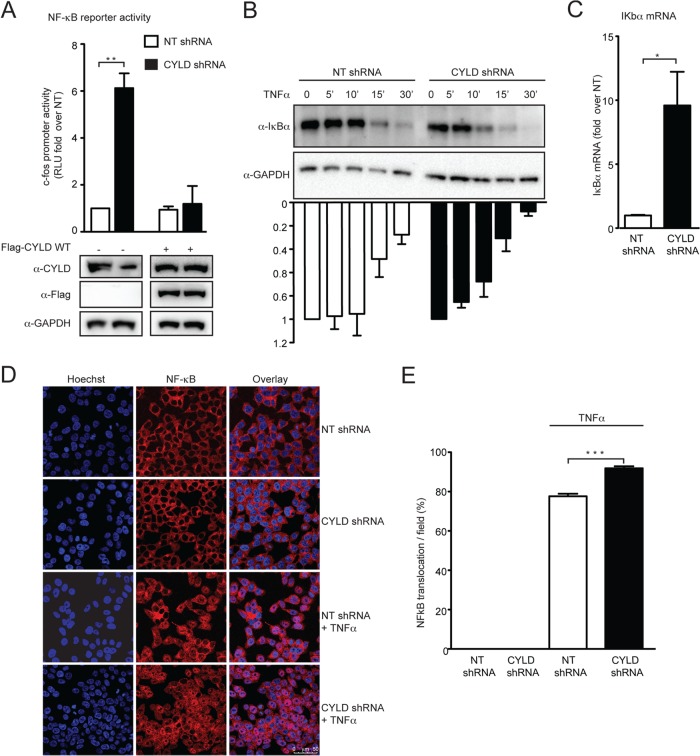
FIG 4.
CYLD silencing increases NF-κB signaling as a general mechanism. (A) CYLD shRNA HEK 293T cells and NT shRNA HEK 293T cells were transfected with a luciferase reporter plasmid under the control of the c-fos gene promoter and a TK-Renilla vector together with empty plasmid or the short-hairpin-resistant form of Flag-CYLD. Luciferase and Renilla expression was measured 48 h later. Luciferase values were normalized to the Renilla values and then plotted as fold change over the NT shRNA control. Values are means plus SEM for three independent experiments. The value for the NT shRNA cells transfected with an empty vector was set to 1, and values represent fold change over NT shRNA-expressing cells. The average of RLU for the mock control is 10,094 ± 1,748. **, P < 0.01 (unpaired t tests, Prism software). Expression of endogenous, FLAG-tagged CYLD and GAPDH was analyzed by Western blotting (lower panel). (B) CYLD shRNA HEK 293T cells and NT shRNA HEK 293T cells were treated with TNF-α (10 ng/ml) for the indicated times. The rate of degradation of IκBα was analyzed by Western blot using anti-IκBα antibody and anti-GAPDH antibody and quantified by densitometric analysis, where IκBα at time zero is set as 1. Values represent the means plus SEM from three independent experiments. (C) Expression of IκBα mRNA at steady state was measured in CYLD shRNA HEK 293T cells and NT shRNA HEK 293T by qPCR analysis. Expression of IκBα mRNA in the NT shRNA HEK 293T cells was set as 1, and data were plotted as fold change compared to NT shRNA HEK 293T cells. Values represent means plus SEM for three independent experiments. IκBα mRNA expression in the NT shRNA is set at 1, and values represent fold change over NT shRNA. Expression of IκBα mRNA relative to the housekeeping gene rsp11 is 0.02. *, P < 0.05 (unpaired t tests, Prism software). (D) Confocal images of CYLD shRNA HEK 293T cells and NT shRNA HEK 293T cells treated with TNF-α (10 ng/ml) or mock treated for 2 h and stained for NF-κB p65 (red) and with Hoechst stain (blue). (E) The number of cells in which the NF-κB p65 subunit translocated to the nucleus was determined by counting five random fields of view per slide, with an average of 200 cells/field. ***, P < 0.001 (unpaired t tests, Prism software).

