FIG 7.
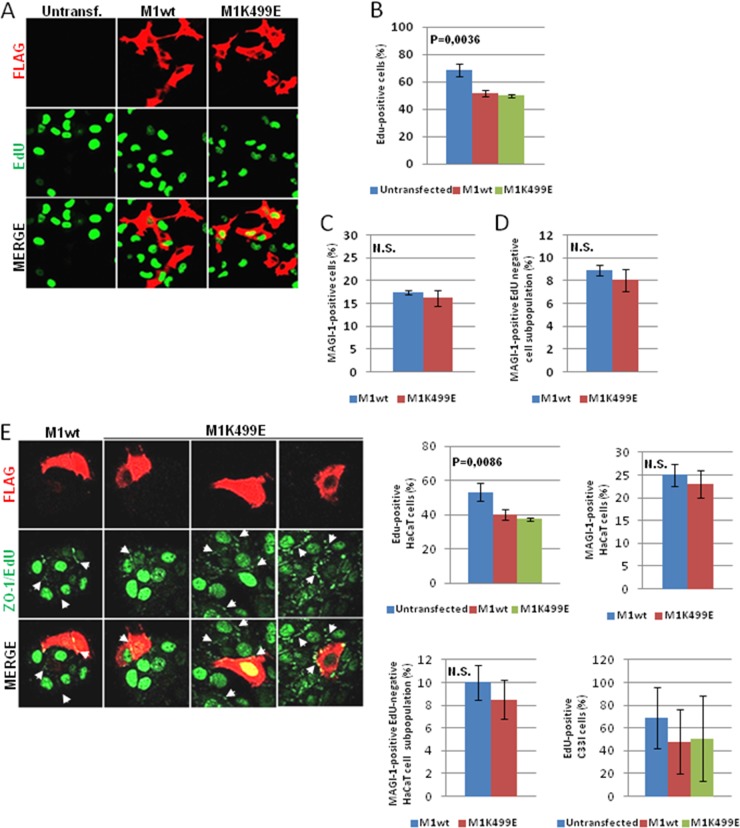
Analysis of MAGI-1 effects on cell proliferation in HPV-negative cells. (A) H1299 cells were seeded on glass coverslips, and transfection was carried out as described for Fig. 6. After 24 h, and prior to fixation, cells were incubated with EdU for an additional 2 h. After fixation, cells were incubated with anti-FLAG antibody and counterstained with rhodamine-conjugated secondary antibody. After incubation with the indicated antibodies, cells were processed for the detection of EdU-labeled DNA (green nuclei). Confocal images were taken at 480- and 510-nm wavelengths. (B) The percentage of EdU-positive cells was quantified by direct cell count of untransfected and wild-type and K499E mutant MAGI-1-transfected cells displaying positive nuclear EdU staining within each subpopulation. Shown are the mean values with standard deviations calculated from multiple independent experiments (one-way ANOVA). (C) The total population of wild-type and mutant MAGI-1-expressing cells was calculated as the percentage of FLAG-positive cells (∼100 cells per sample) present in each sample relative to the total population of untransfected cells (P = 0.56; unpaired two-sample t test). (D) Cells were counted as described for panel B, and shown is the percentage of MAGI-1-positive cells displaying EdU-negative staining relative to the total population of cells counted in each sample. Shown are the mean values with standard deviations calculated from multiple independent experiments (P = 0.48; unpaired two-sample t test). (E) HaCaT and C33I cells were processed as described for panel A. Immunofluorescent images are of HaCaT cells, with white arrows indicating sites of MAGI-1 and ZO-1 junctional accumulation. The top left and right histograms show the percentage of EdU-positive HaCaT and C33I cells quantified by direct cell count of untransfected and wild-type and K499E mutant MAGI-1-transfected cells displaying positive nuclear EdU staining within each subpopulation (one-way ANOVA). The bottom histograms show the total population of wild-type and mutant MAGI-1-expressing HaCaT cells calculated as described for panel C (left) and the percentage of MAGI-1-positive HaCaT cells displaying EdU-negative staining relative to the total population of untransfected cells counted in each sample (right). Each panel represents the mean values and standard deviations calculated from three independent experiments. The corresponding P values are as follows: *, P < 0.05; **, P < 0.01; ***, P < 0.001; ****, P < 0.0001; N.S., not significant.

