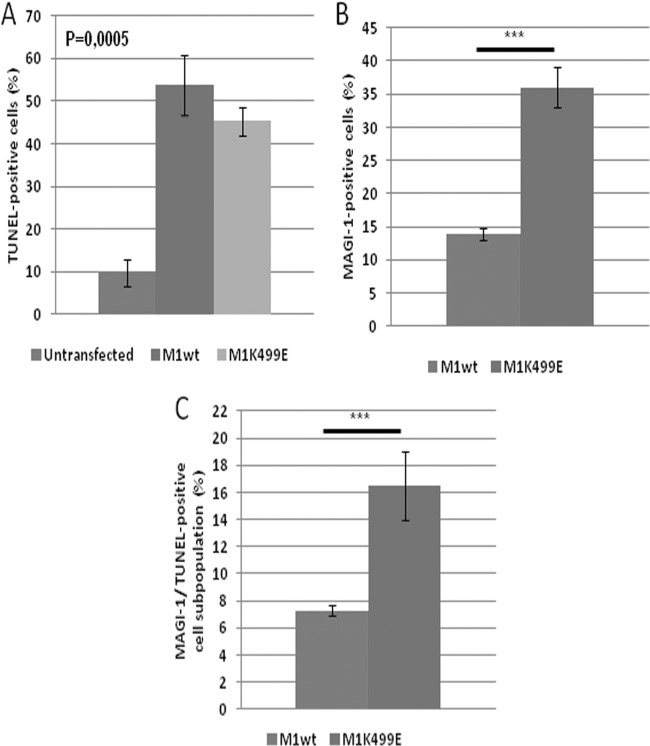
FIG 9.
Quantitation of cells exhibiting signs of apoptosis following expression of MAGI-1. (A) The percentage of TUNEL-positive HeLa cells was quantified by direct cell count of untransfected, wild-type, or K499E mutant MAGI-1-transfected cells displaying positive TUNEL staining within each subpopulation. Shown are the mean values with standard deviations calculated from multiple independent experiments. (B) The total population of wild-type and mutant MAGI-1-expressing cells was calculated as the percentage of FLAG-positive cells (∼100 cells per sample) present in each sample relative to the total population of untransfected cells. (C) Cells were counted as described for panels A and B, and shown is the percentage of MAGI-1-positive cells displaying TUNEL-positive staining relative to the total population of untransfected cells counted in each sample. Shown are the mean values with standard deviations calculated from multiple independent experiments. The corresponding P values are as follows: *, P < 0.05; **, P < 0.01; ***, P < 0.001; ****, P < 0.0001.

