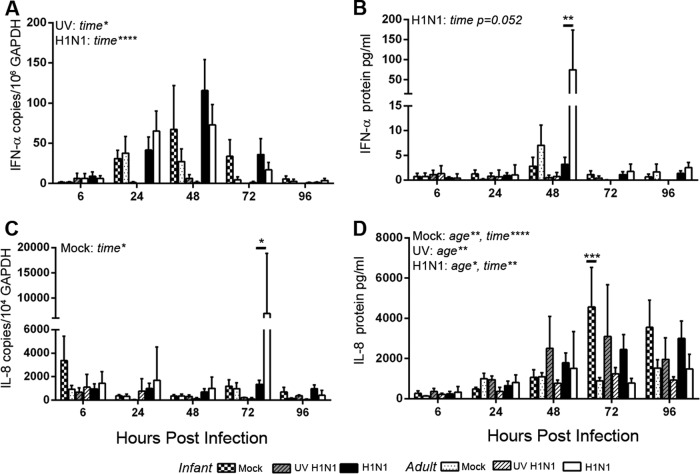
FIG 5.
Absolute values for infant and adult airway epithelial cell cytokine responses to H1N1 infection. IFN-α and IL-8 cytokine responses were measured at 6, 24, 48, 72, and 96 h after mock infection and UV-inactivated and live H1N1 virus infections at an MOI of 1 (n = 3 to 6). Cytokine and GAPDH mRNA levels were measured in airway epithelial cells by RT-PCR. (A and C) Gene copy numbers relative to GAPDH copy numbers were calculated based on standard curves for IFN-α (A) and IL-8 (C). (B and D) Cytokine protein secretion into the basolateral medium was measured by ELISAs for pan-IFN-α (B) and IL-8 (D). Bar graphs represent means and SEM. Statistically significant results from two-way ANOVA comparing age and time postinfection were determined for each condition separately and are indicated at the top left of the graphs (mock, UV-inactivated virus, or live virus). Horizontal bars show results of Holm-Sidak posttests. *, P < 0.05; **, P < 0.05; ****, P < 0.0001.

