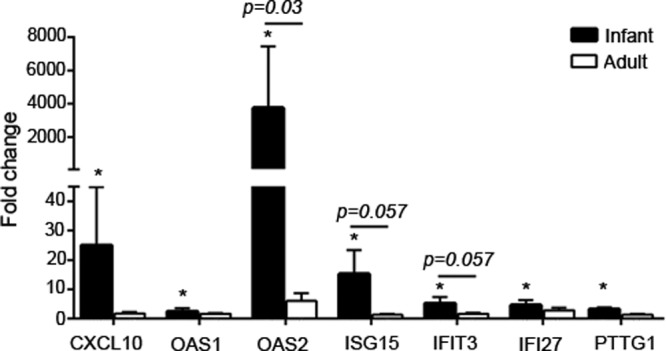
FIG 7.

IFN-α and -β pathway gene expression in H1N1-infected airway epithelial cell cultures. IFN-α and -β array data are graphed for all mRNAs that were significantly modulated at 24 h post-H1N1 infection in infant and/or adult cultures. The average fold changes in gene expression levels and SEM in H1N1-infected animals compared to age-matched, mock-infected controls are graphed for infant (n = 4) and adult (n = 4) epithelial cell cultures. *, P < 0.05 by Student's t test for infection-induced fold changes. The horizontal bar and indicated P values are for comparisons between infant and adult fold changes in gene expression values determined by Student's t tests.
