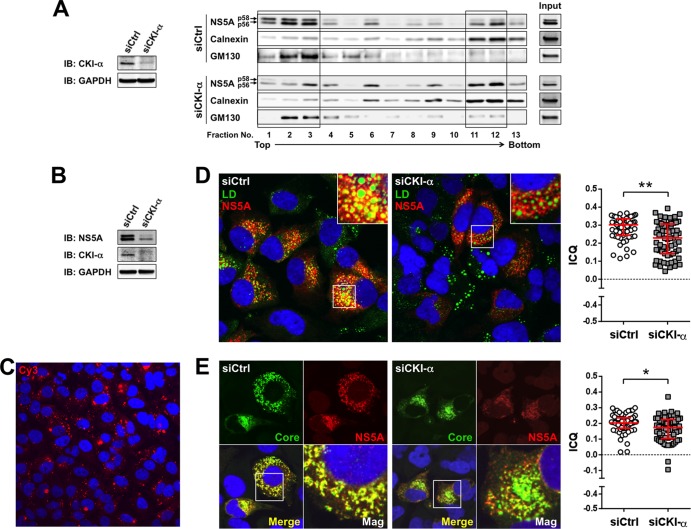
FIG 5.
Effects of CKI-α knockdown on the subcellular localization of NS5A and its interaction with LDs or core protein. (A) Iodixanol density gradient analysis (right). Huh7-25 cells transfected with the indicated siRNAs were coelectroporated with the identical siRNAs and JFH-1 RNA. Cell lysates were prepared 3 days after electroporation and fractionated by iodixanol gradients of 2.5% to 30%. The gradient was collected in 0.8-ml fractions for immunoblotting. Total cell lysates before fractionation were loaded as input controls. Detected bands in fractions 1 to 3 and in fractions 11 and 12 are enclosed by squares. (Left) Immunoblotting (IB) results for CKI-α 3 days after electroporation. GAPDH was included as a loading control. (B) Immunoblot (IB) of NS5A and CKI-α 3 days after HCVcc infection. GAPDH was included as a loading control. (C) siRNA delivery efficiency. Cy3 fluorescence (red) was observed 3 days after transfection of Silencer Cy3-labeled GAPDH siRNA. Nuclei were counterstained with Hoechst 33342 (blue). (D) Colocalization of NS5A and LDs. Confocal microscopy images show cells transfected with either CKI-α siRNA (siCKI-α) or an irrelevant control siRNA (siCtrl), followed by infection with JFH-1 virus (left). Cells were fixed with paraformaldehyde 3 days after infection and labeled with an antibody specific for NS5A (red). Cells were counterstained with BODIPY 493/503 (green) to label lipid droplets and with Hoechst 33342 (blue) to label nuclei. Insets represent enlarged views of portions surrounded by squares. Colocalization of NS5A and LDs pixels were assessed quantitatively by intensity correlation analysis using ImageJ software (right). Plots shown represent the ICQ obtained from each of >60 NS5A/LD double-positive cells. Bars indicate the median ± interquartile range of the plots. **, P < 0.01 by two-sided Mann-Whitney test. (E) Colocalization of NS5A and core protein. Confocal microscopy images show cells transfected either with CKI-α siRNA (siCKI-α) or with a control siRNA (siCtrl), followed by infection with JFH-1 virus (left). Fixed cells were labeled with antibodies specific for NS5A (red) and core (green). Nuclei were counterstained with Hoechst 33342 (blue) in the merged images. Mag images represent enlarged views of portions surrounded by squares in the merged images. Colocalization of NS5A and core pixels was assessed quantitatively by intensity correlation analysis using ImageJ software (right). Plots shown represent ICQs obtained from each of >60 NS5A/core double-positive cells. Bars indicate the median ± interquartile range. *, P < 0.05 by two-sided Mann-Whitney test.

