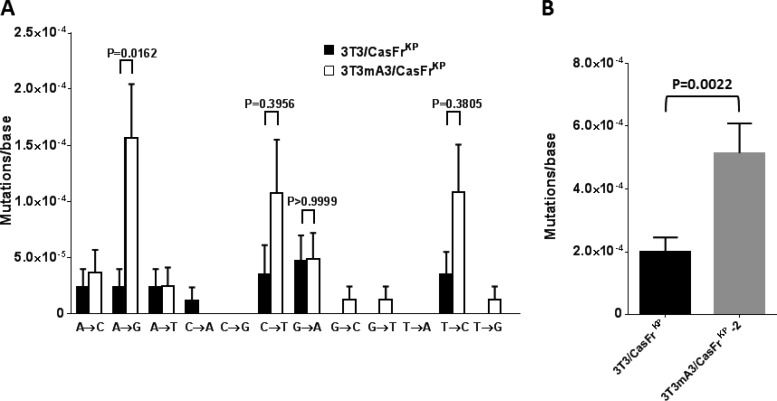
FIG 3.
Influence of mA3 on RT fidelity. 3T3 cells were infected with viruses released from each of the clonal cell lines, and the nucleotide sequences of env gene transcripts synthesized during the first 8 h were determined. (A) The rates of all transition and transversion mutations are shown. Error bars represent the standard errors of detected mutations on approximately 90 transcripts from each of the infections, totaling about 85,000 bases analyzed for each virus. P values determined by one-way ANOVA using Sidak's multiple comparisons test are indicated for the transition mutations. P values of <0.05 were considered significant. (B) The rates of all transition and transversion mutations shown in panel A were combined to calculate the overall mutation rates. Error bars represent the standard errors of detected mutations. The P value determined by Student's unpaired t test is indicated. P values of <0.05 were considered significant.

