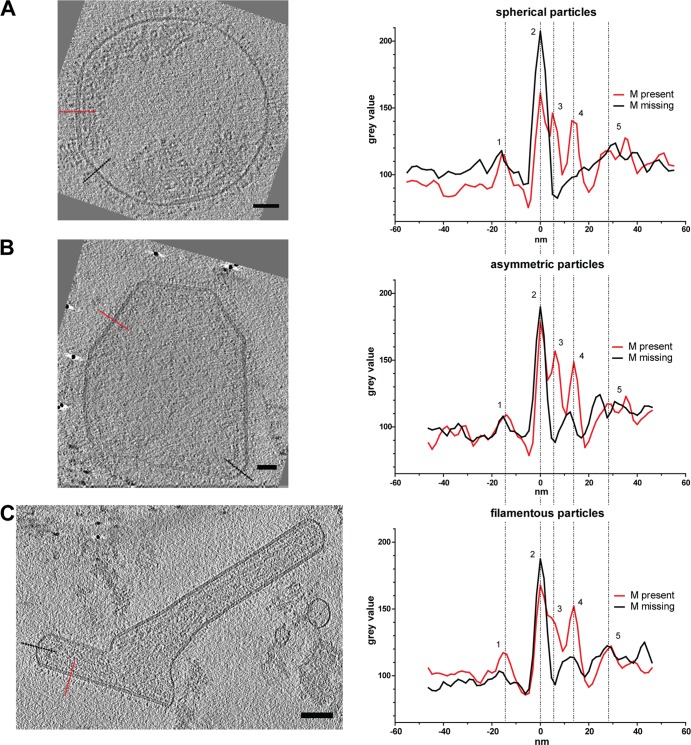
FIG 4.
Linear profiles through hRSV particles. Slices (4.5 nm) from tomographic reconstructions of hRSV viral particles indicate the regions used to generate the linear profiles from the three hRSV morphologies (spherical [A], asymmetric [B], and filamentous [C]). The red dotted line marks regions with M, and the black dotted line marks regions without M. Linear profile graphs show the density peaks in the presence (red) or absence (black) of M in the viral particles. Peaks of the different structural components are marked in the density profile: surface glycoproteins (1), viral membrane (2), matrix (3), M2-1 (4), and RNP (5). Scale bars, 50 nm.

