FIG 4.
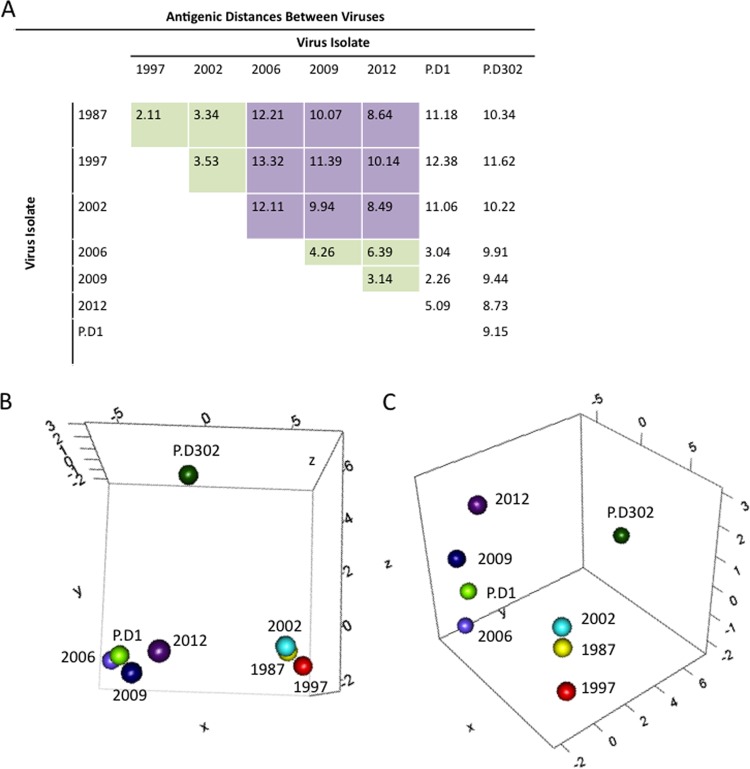
Antigenic cartography for GII.4 noroviruses. MDS was used to identify the antigenic relationships between different norovirus strains. (A) Euclidean antigenic distances between virus strains were calculated based on the EC50 efficacies of antisera raised against GII.4-1987, GII.4-2002, GII.4-2006b, GII.4-2009, P.D1, and P.D302 VLPs. The green squares represent distances within either the early (1987, 1998, and 2002) or late (2006, 2009, and 2012) virus groups. The purple squares show the distances between early and late virus groups. (B and C) We determined XYZ coordinates that maintain the underlying Euclidean distances between viruses while illustrating the relationships between GII.4 norovirus strains, with each map distance roughly corresponding to an ∼1.25-fold change in blockade response. (B) Early strains GII.4-1987 (yellow), GII.4-1997 (red), and GII.4-2002 (light blue) grouped together (lower right), and the late strains GII.4-2006b (light purple), GII.4-2009 (dark blue), and GII.4-2012 (dark purple) grouped together (lower left). P.D1 grouped with late strains, closest to GII.4-2006b, while P.D302 was separate from either late or early strains (top). (C) Side view of the same 3D graph as in panel B, showing the antigenic differences between strains.

