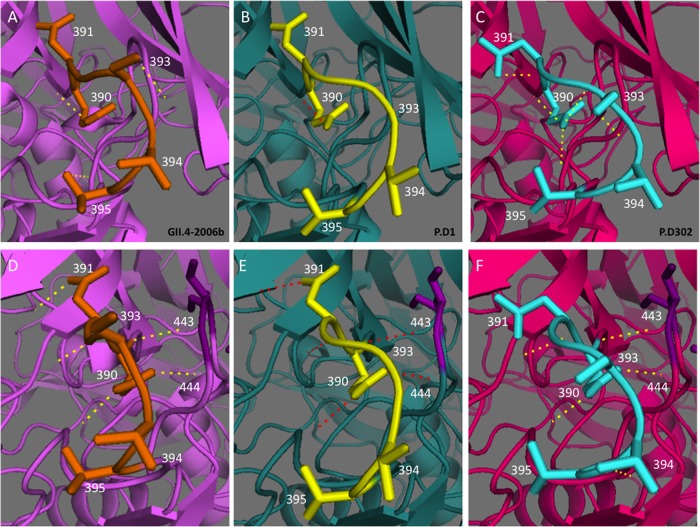
FIG 6.
Comparison of epitope site D polar interactions among GII.4-2006 and chronic-infection strains. PyMOL was used to model the polar interactions within residues 390 to 395 (A to C) and interactions between these residues and surrounding residues (D to F). GII.4-2006b is shown in purple (A and D), P.D1 is shown in teal (B and E), and P.D302 is shown in pink (C and F). Residues 390 to 395 are shown in orange for GII.4-2006b, yellow for P.D1, and aqua for P.D302. The dotted lines represent structure-based predicted polar interactions. (D to F) The dark-purple residues represent positions that interact with HBGAs.

