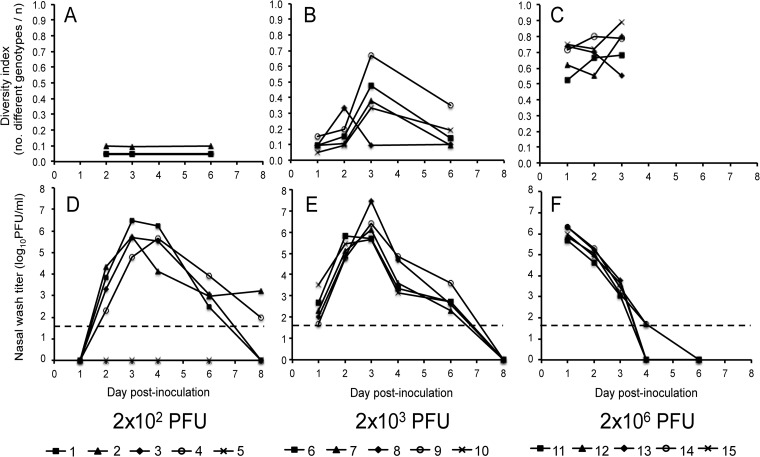
FIG 1.
The kinetics of viral growth and reassortment in guinea pigs are dose dependent. In the top panels (A, B, and C), viral genomic diversity, calculated as the number of different genotypes identified divided by the number of viral clones analyzed, is plotted as a function of day postinoculation. The bottom panels (D, E, and F) show virus titers present in nasal washings collected 1, 2, 3, 4, 6, and 8 days after inoculation. Dashed lines indicate the limit of detection (50 PFU/ml). The data are plotted for each individual guinea pig, and the symbols used for each animal are indicated under the corresponding graphs. Guinea pigs 1 to 5 were inoculated with 1 × 10² PFU wt and 1 × 10² PFU var virus (A and D), guinea pigs 6 to 10 received 1 × 10³ PFU wt and 1 × 10³ PFU var virus (B and E), and guinea pigs 11 to 15 received 1 × 10⁶ PFU wt and 1 × 10⁶ PFU var virus (C and F).

