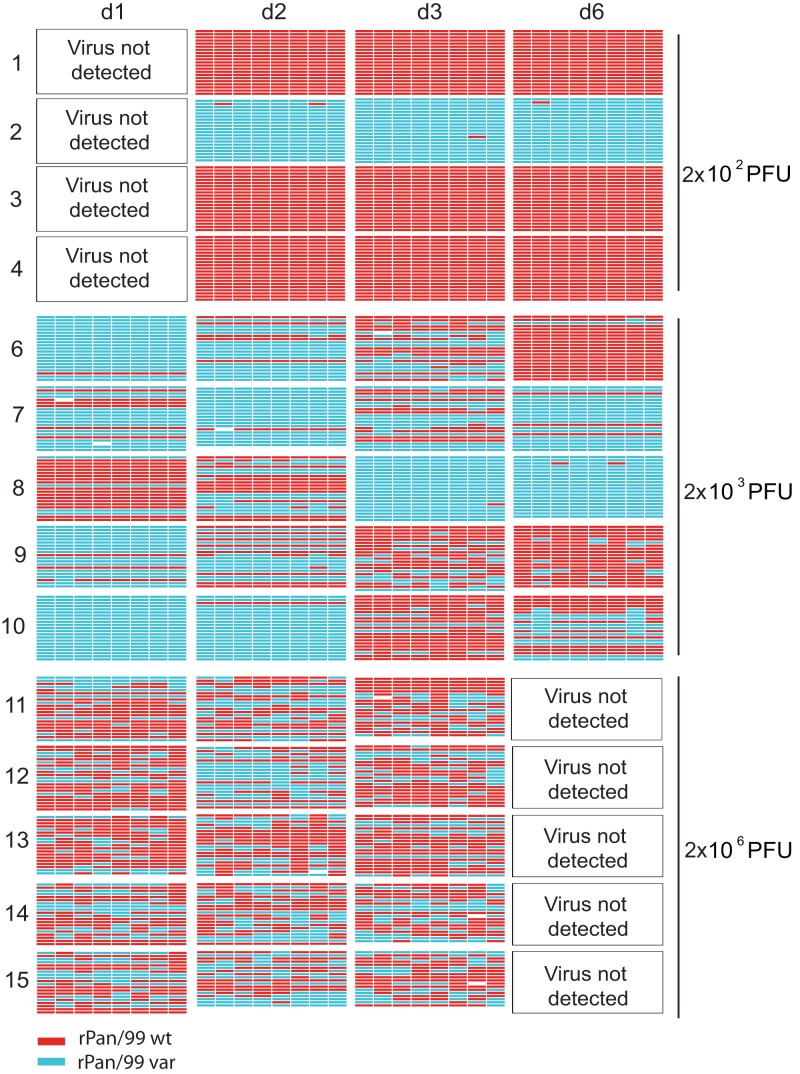
FIG 2.
Viral genotypes detected in coinfected guinea pigs over the course of infection. Viral gene segments are represented schematically by eight colored bars arranged horizontally: PB2, PB1, PA, HA, NP, NA, M, and NS segments are shown from left to right. Red indicates wt, turquoise represents var, and white bars signify segments that could not be typed. The 18 to 21 viral isolates genotyped from each nasal lavage sample are grouped together. The guinea pig from which viruses were collected is indicated at the left (numbers 1 to 15). Note that guinea pig 5 is not included, since virus was not detected in this animal throughout the time course. The day postinfection on which nasal lavage samples were collected is shown at the top. The doses of wt and var virus administered to the guinea pigs are shown at the right of the figure. The phrase “virus not detected” indicates nasal wash samples for which the virus titer was below the limit of detection of the plaque assay (50 PFU/ml).

