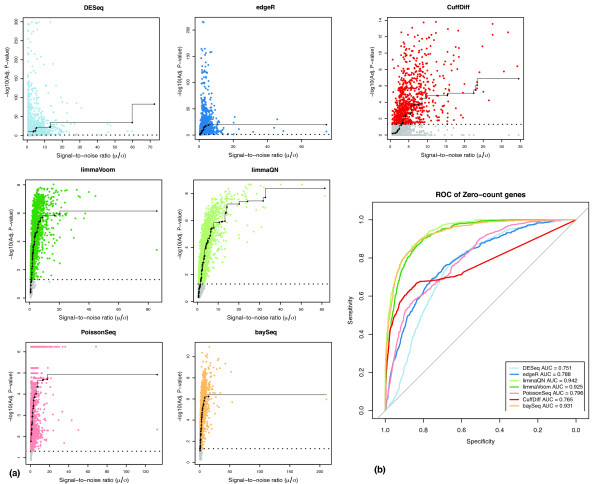
Figure 4.

Comparison of signal-to-noise ratio and differential expression (DE) for genes expressed in only one condition. (a) The correlation between signal-to-noise and -log10(P) was used to evaluate the accuracy of DE among genes expressed in one condition. A total of 10,272 genes was exclusively expressed in only one of the contrasting conditions in the DE analysis between the three ENCODE datasets. Gray shaded points indicate genes with adjusted P value ≥ 0.05, which are typically considered not differentially expressed. The results show that Cuffdiff, edgeR and DESeq do not properly account for variance in measurements as indicated by poor agreement with the isotonic regression line. (b) ROC curves for detection of DE at signal-to-noise ratio of ≥3. AUC: area under curve.
