
Figure 2.
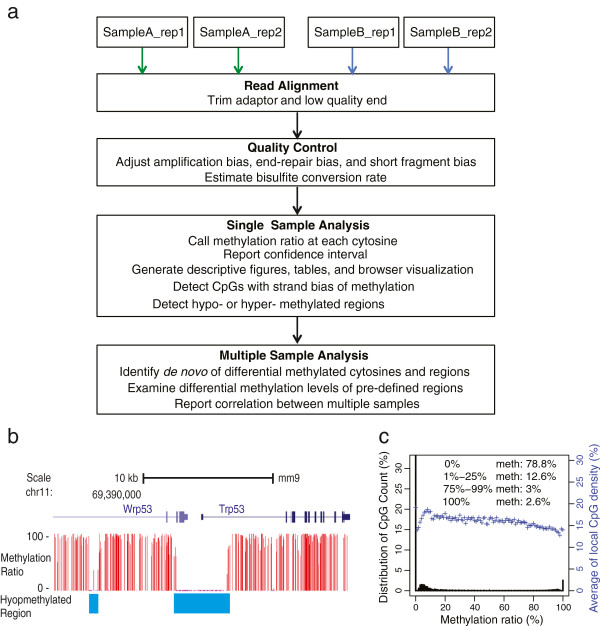
Overview of the MOABS software pipeline. (a) Comprehensive workflow of the MOABS pipeline. (b) An example of hypo-methylated region. (c) A descriptive figure for global methylation distribution of a mouse methylome. The Y-axis on the left is percent of CpGs and the Y-axis on the right is the average of local CpG density at each specified methylation ratio.