
Figure 2.
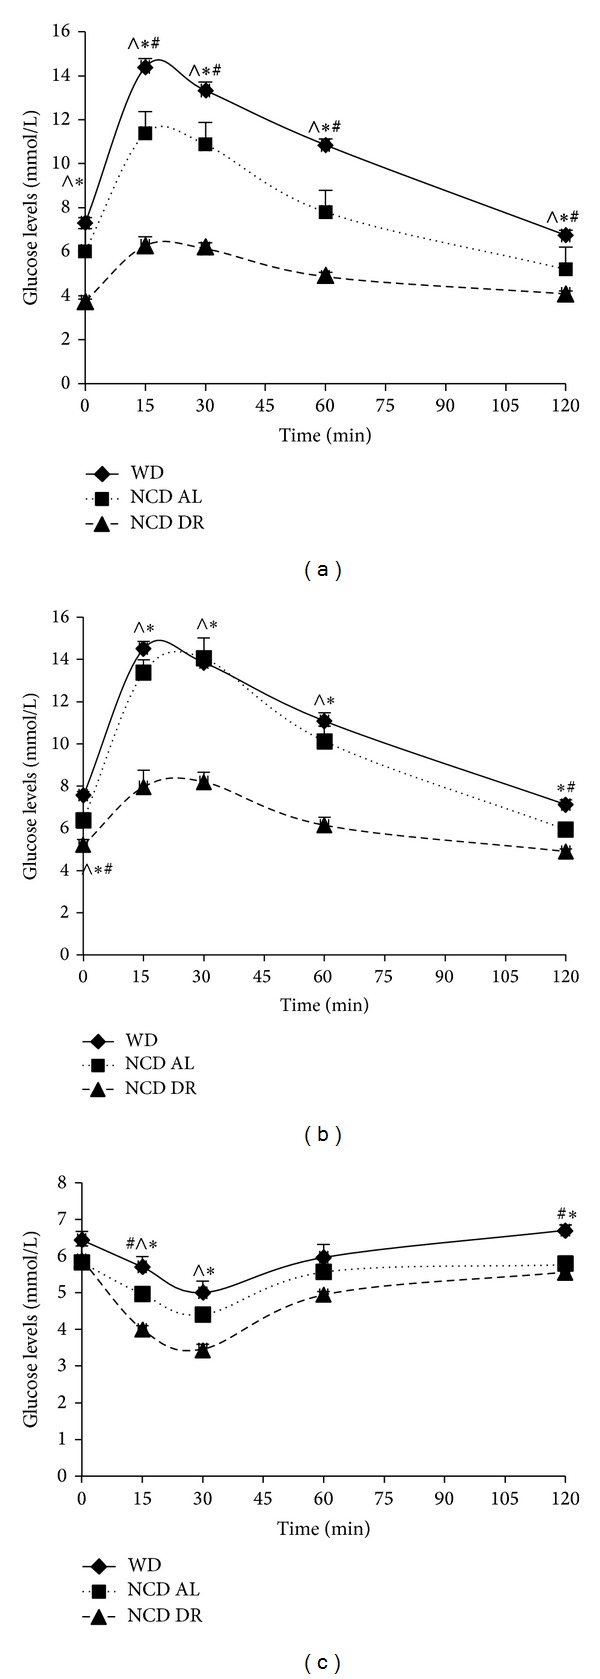
Glucose test at 15 weeks (a), glucose tolerance test at 27 weeks (b), and insulin tolerance test at 27 weeks (c). Results are expressed as changes in glucose levels after an I.P challenge of 2 g/kg glucose and 0.75 U/kg insulin. Data is presented as the mean (SE) (n = 5 for NCD AL and NCD DR and n = 15 for WD for glucose tolerance test and n = 5/group for insulin tolerance test). # P < 0.05 for WD compared to NCD AL, *P < 0.05 for WD compared to NCD DR, ∧ P < 0.05 NCD AL compared to NCD DR.