
Figure 3.
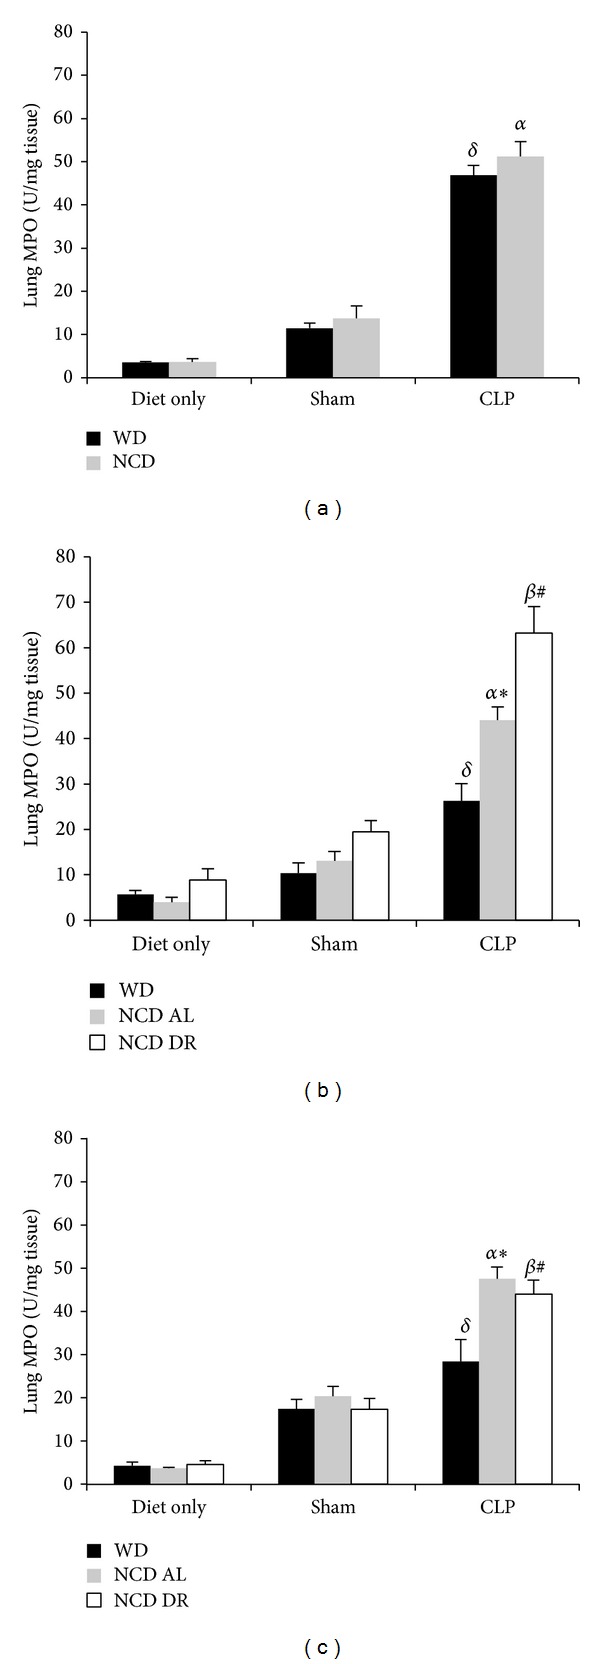
Lung MPO levels after 6 weeks (a), 15 weeks (b), and 27 weeks (c). Data is presented as the mean (SE) (n = 5/group). δ P < 0.05 for WD CLP compared to WD sham and diet only. α P < 0.001 for NCD AL CLP compared to NCD diet only and shams. β P < 0.0001 for NCD DR CLP compared to NCD DR sham and diet only. *P < 0.01 for WD CLP compared to NCD AL CLP. # P < 0.01 for WD CLP compared to NCD DR CLP.