
Figure 6.
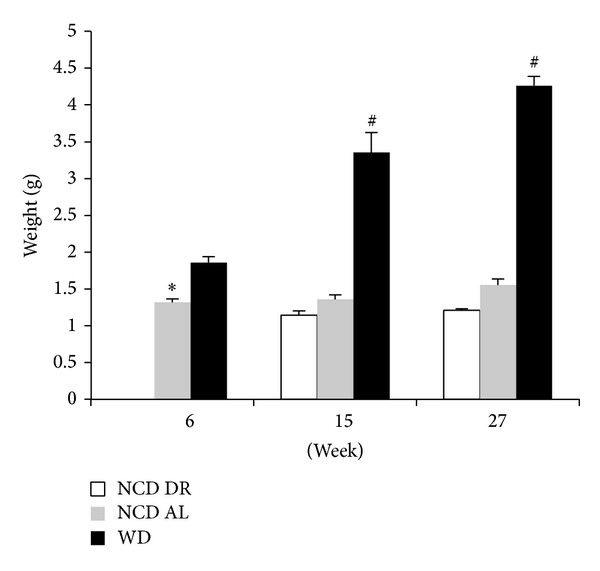
Liver weights of each diet group at their respective end points. Data is presented as the mean (SE) (n = 15/group). # P < 0.0001 for WD compared to NCD AL and NCD DR. *P < 0.01 for WD compared to NCD AL at 6 weeks.
Official websites use .gov
A
.gov website belongs to an official
government organization in the United States.
Secure .gov websites use HTTPS
A lock (
) or https:// means you've safely
connected to the .gov website. Share sensitive
information only on official, secure websites.
Liver weights of each diet group at their respective end points. Data is presented as the mean (SE) (n = 15/group). # P < 0.0001 for WD compared to NCD AL and NCD DR. *P < 0.01 for WD compared to NCD AL at 6 weeks.