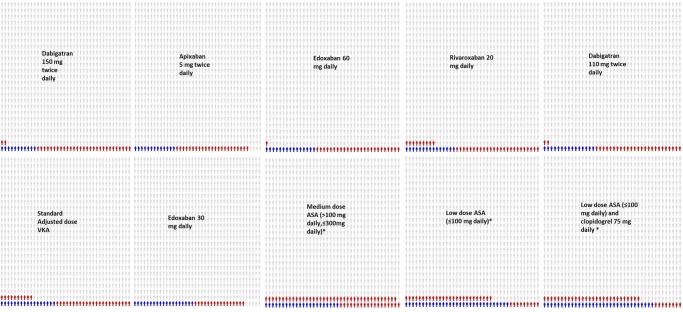
Figure 4.
Icon array illustrating the absolute risks of Stroke or systemic embolism (blue) and major bleeding episodes (red) per 1000 patients treated. (Figures do not reflect uncertainty around effect estimates and there is more uncertainty (ie, wider credible intervals) for low-dose ASA, medium-dose ASA and clopidogrel plus low dose ASA (see online supplementary appendix 8). Underlying studies may also double count haemorrhage stroke.)

