
Figure 4.
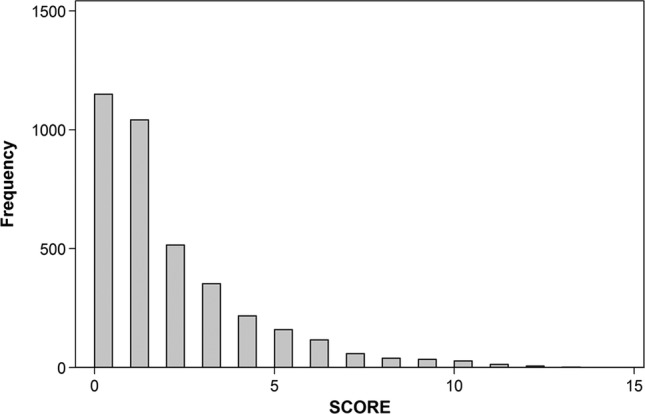
Histogram of severity score distribution: the y-axis (frequency) indicates the number of episodes assigned to the score (N=3915).
Official websites use .gov
A
.gov website belongs to an official
government organization in the United States.
Secure .gov websites use HTTPS
A lock (
) or https:// means you've safely
connected to the .gov website. Share sensitive
information only on official, secure websites.
Histogram of severity score distribution: the y-axis (frequency) indicates the number of episodes assigned to the score (N=3915).