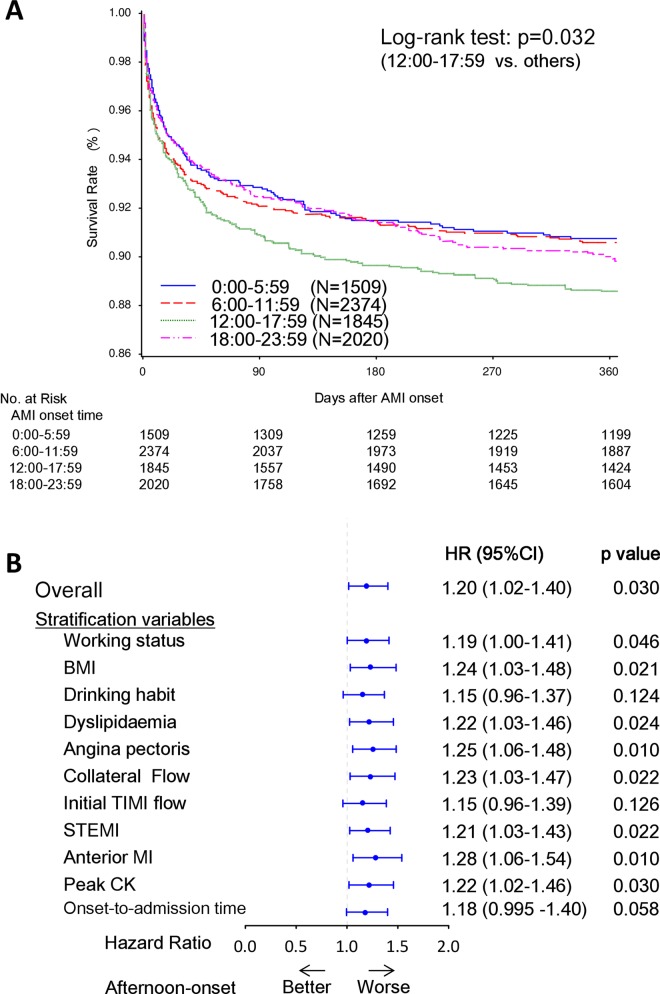
Figure 4.
One-year mortality according to the onset time of AMI onset. (A) One-year mortality among the four subgroups based on AMI onset time. (B) HRs for 1-year mortality in the afternoon-onset group versus the other three onset time groups. The Kaplan-Meier survival curves of 1-year mortality among the four AMI onset time subgroups (A). A p value from the log-rank test was used to examine difference in the Kaplan-Meier curves. The HR and 95% CI, and p value for the overall population was calculated using univariable Cox regression analysis. The HRs and 95% CIs, and p values for the individual potential confounding variables were calculated using stratified Cox regression analysis, in which the variables were included into the model as stratification factors (B). AMI, acute myocardial infarction; BMI, body mass index; CK, creatine kinase; STEMI, ST-elevation MI.

