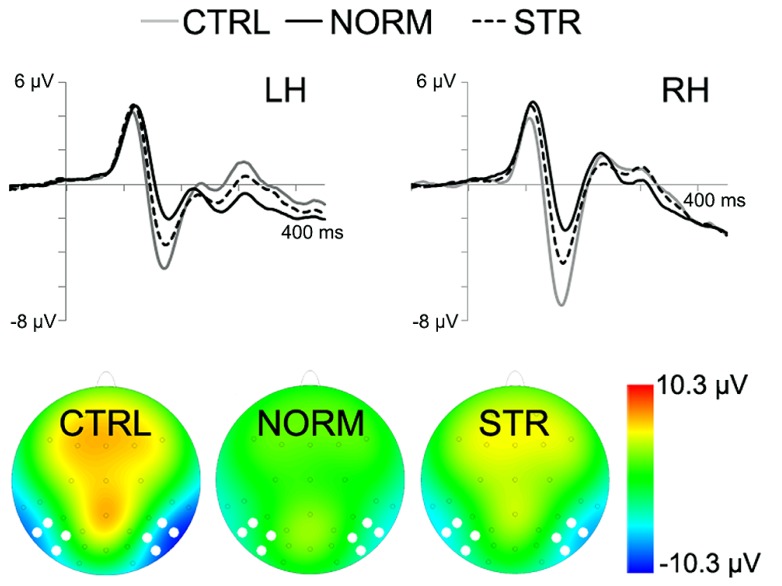
FIGURE 4.
Grand average ERPs for the CTRL (gray line), NORM (black continuous line) and STR (black dashed line). The bottom of the figure depicts the topographical maps of the activity with white dots marking the electrode locations, used for N170 analysis (10 ms time-window centered on the peak). Negativity is indicated by blue.

