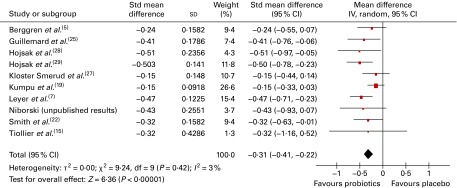
Fig. 3.

Duration of illness per person. In this meta-analysis, dichotomous and continuous data were pooled. The totals used in this analysis (not shown) were mostly the number of individuals with at least one illness episode (see Table 3). In one study( 7 ), the totals used in the analysis were the numbers of participants included in the study, and in another study( 22 ), the totals used were the numbers of ‘cases’ of illness (in both studies, the number of individuals with illness episodes was not reported). (A colour version of this figure can be found online at http://www.journals.cambridge.org/bjn).
