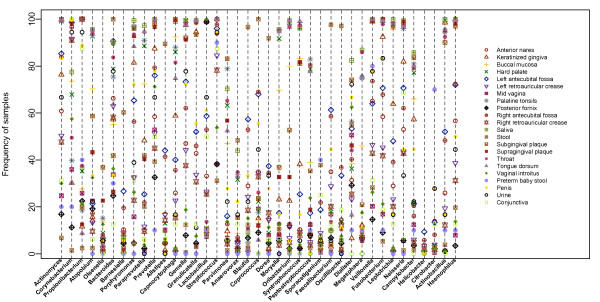
Figure 7.

Taxa distribution across habitats. Thirty-nine genera present in at least one subject for all 18 HMP habitats are plotted. Each symbol represents a habitat. The y-axis shows the sample prevalence of the genera calculated as the number of samples who harbor the genus divided by the total number of subjects. Using this criterion, 12 of these genera are spread across all 22 habitats.
