
Figure 2.
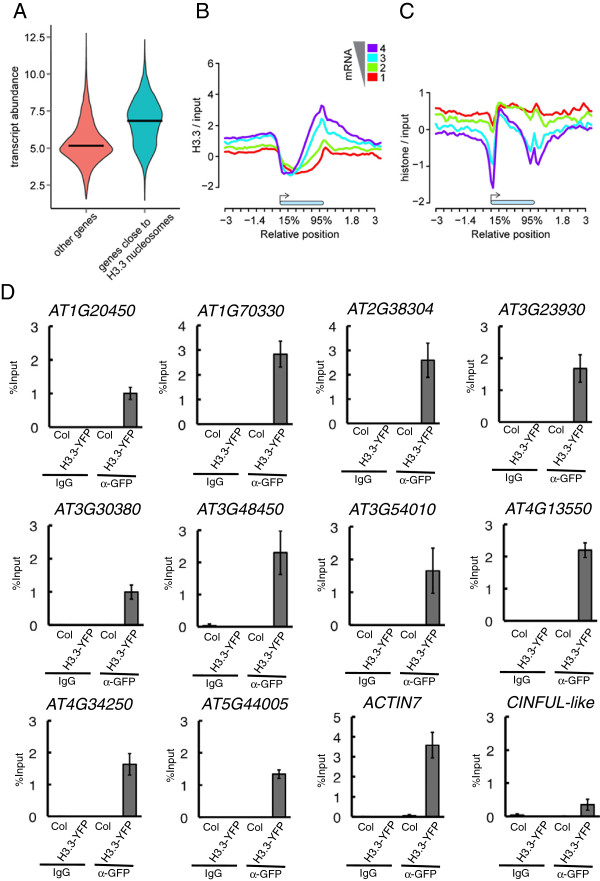
H3.3 is enriched at transcribed genes and has a strong 3′ bias. (A) Genes with at least one H3.3 nucleosome (right) have higher transcript abundance than genes without H3.3 (left). Horizontal bars indicate median values. Expression data are from [22] and in logarithmic scale. (B,C) H3.3 nucleosome (B) and total nucleosome (C) occupancy were measured as H3.3-YFP-ChIP and histone-ChIP signals, respectively. Metagene plots across gene bodies (blue bar) were constructed between -3 kb and +3 kb. Genes were grouped according to transcript abundance from low (red) to high (violet). (D) Validation of H3.3 at promoters by ChIP-qPCR. 5′ Upstream regions of 10 genes that had H3.3-enrichment at promoters in the ChIP-chip experiment were tested. ACTIN7 and a CINFUL-like locus served as controls. Error bars represent standard error of mean, n = 3. GFP, green fluorescent protein.